
Go CPU and Memory Requests and Limits in Kubernetes
October 2026

A small Go heap does not always mean low container memory usage.
The heap shares the container's memory limit with goroutine stacks, runtime metadata, cgo allocations, and memory mapped directly from the operating system.
Linux can kill a Go process even when its heap looks healthy.
CPU limits and Go's parallelism limit control different things, too.
Kubernetes limits the CPU time available to the container. Go uses the available CPU to choose how many operating system threads can run Go code at once.
Go does not automatically set GOMEMLIMIT, its soft memory limit, from the container's memory limit.
This article explains how Kubernetes requests and limits affect Go services and shows how to test them under load.
Table of contents
- How Go uses container limits
- The CPU limit affects GOMAXPROCS, but the request does not
- A limit below two cores still produces GOMAXPROCS=2
- Without a CPU limit, Go uses the available CPUs
- The module's Go version and GODEBUG settings control this behavior
- The runtime tracks changing limits
- CPU limits are shared budgets
- Go memory is more than the live heap
- The container limit is a hard stop, but GOMEMLIMIT is just a target
- Two ways a Go pod runs out of memory
- GOGC sets the pace until the memory limit takes over
- GOMEMLIMIT does not cover memory allocated outside Go
- Active goroutine stacks use runtime memory
- Putting the resource settings together
- Summary
How Go uses container limits
Before we begin, the examples use a small Go app with no external dependencies, packaged as a Docker image.
GET /health: Returnsokfor health probes.GET /info: Reports Go's runtime settings, the container's CPU and memory controls, and a memory breakdown.GET /heap?mb=N&hold=true: Allocates N MiB of byte slices and optionally keeps them reachable.GET /offheap?mb=N: Allocates N MiB directly from the operating system withmmap, outside Go's memory accounting.GET /churn?seconds=N&kb=K: Allocates short-lived heap objects and reports GC cycles, pause time, estimated GC CPU usage, GC limiter activity, and CPU throttling.GET /goroutines?count=N&stackKb=K: Parks N goroutines, each with K recursive frames, and reports measured stack memory.GET /cpu?seconds=N&workers=W: Runs W busy goroutines, then reports process CPU usage, completed loop operations, container CPU throttling, and timer lateness against explicit 5ms deadlines. Timer lateness is not the same as HTTP request latency.GET /release: Removes held heap references, requests a GC, unmaps direct mappings, and stops parked goroutines. It reports anymunmaperrors.
We will use these endpoints to compare container limits with Go's runtime settings and see how the service behaves under load.
Consider a container with these limits:
resources.yaml
resources:
  limits:
    cpu: '2'
    memory: 512Mi
Kubernetes uses these values to limit the container's CPU time and total memory.
With Go 1.27's container-aware default enabled, the runtime handles the two limits differently:
- The CPU quota helps select
GOMAXPROCS, the maximum number of threads that can run Go code at once. - The memory limit does not set
GOMEMLIMIT, Go's soft limit on runtime-managed memory.
The container's memory limit and Go's soft memory limit are separate settings.
The CPU limit affects GOMAXPROCS, but the request does not
GOMAXPROCS controls how many operating system threads can run Go code at once.
Threads waiting on system calls do not count.
Even with a million goroutines, a service runs Go code on no more than GOMAXPROCS threads.
With Go 1.24 and earlier, that default came from runtime.NumCPU, the number of logical CPUs available to the process at startup.
A CPU limit caps average throughput but does not hide any logical CPUs.
Under the old default, a pod with a two-core limit can run Go code on 64 threads if 64 CPUs are available.
In Go 1.27, the default depends on the logical CPU count, the CPUs available to the process, and the container's CPU limit.
The CPU request is not part of that calculation and this matters because requests and limits usually differ in a manifest.
To see this in the demo, start the app with the same two-core CPU limit and 512MiB memory limit.
Set the Go soft limit to 460MiB. This leaves headroom for memory outside Go's accounting.
These examples require Linux containers with cgroup v2 mounted at /sys/fs/cgroup, Docker, curl, and jq.
Start the container:
bash
docker run --rm -d --name go-demo \
  --memory=512m --memory-swap=512m \
  --cpus=2 \
  -e GOMEMLIMIT=460MiB \
  -p 127.0.0.1:8080:8080 \
  ghcr.io/learnk8s/go-requests-limits:latest >/dev/null
Wait for the health endpoint:
bash
curl --retry 10 --retry-connrefused --retry-delay 1 \
  -sf localhost:8080/health >/dev/null
Compare the CPU limit with the value Go selected:
bash
curl -s localhost:8080/info | jq .cpu

{
  "cgroupCPULimit": 2,
  "cgroupCPUMax": "200000 100000",
  "godebug": "",
  "gomaxprocs": 2,
  "gomaxprocsEnv": "",
  "numCPU": 24
}
This host exposes 24 logical CPUs, but the two-core quota produces GOMAXPROCS=2.
Here is the same image under different limits, with everything else unchanged:
- No CPU limit:
cpu.maxreadsmax 100000,GOMAXPROCSis 24. --cpus=0.5:cpu.maxreads50000 100000,GOMAXPROCSis 2.--cpus=1:cpu.maxreads100000 100000,GOMAXPROCSis 2.--cpus=2.5:cpu.maxreads250000 100000,GOMAXPROCSis 3.--cpus=4:cpu.maxreads400000 100000,GOMAXPROCSis 4.
The runtime picks the smallest of three numbers: the logical CPU count, the CPUs the process can use, and the CPU limit rounded up.
A limit below two cores counts as two whenever the process can use at least two CPUs.
On this host, a 2500m limit produced 3.
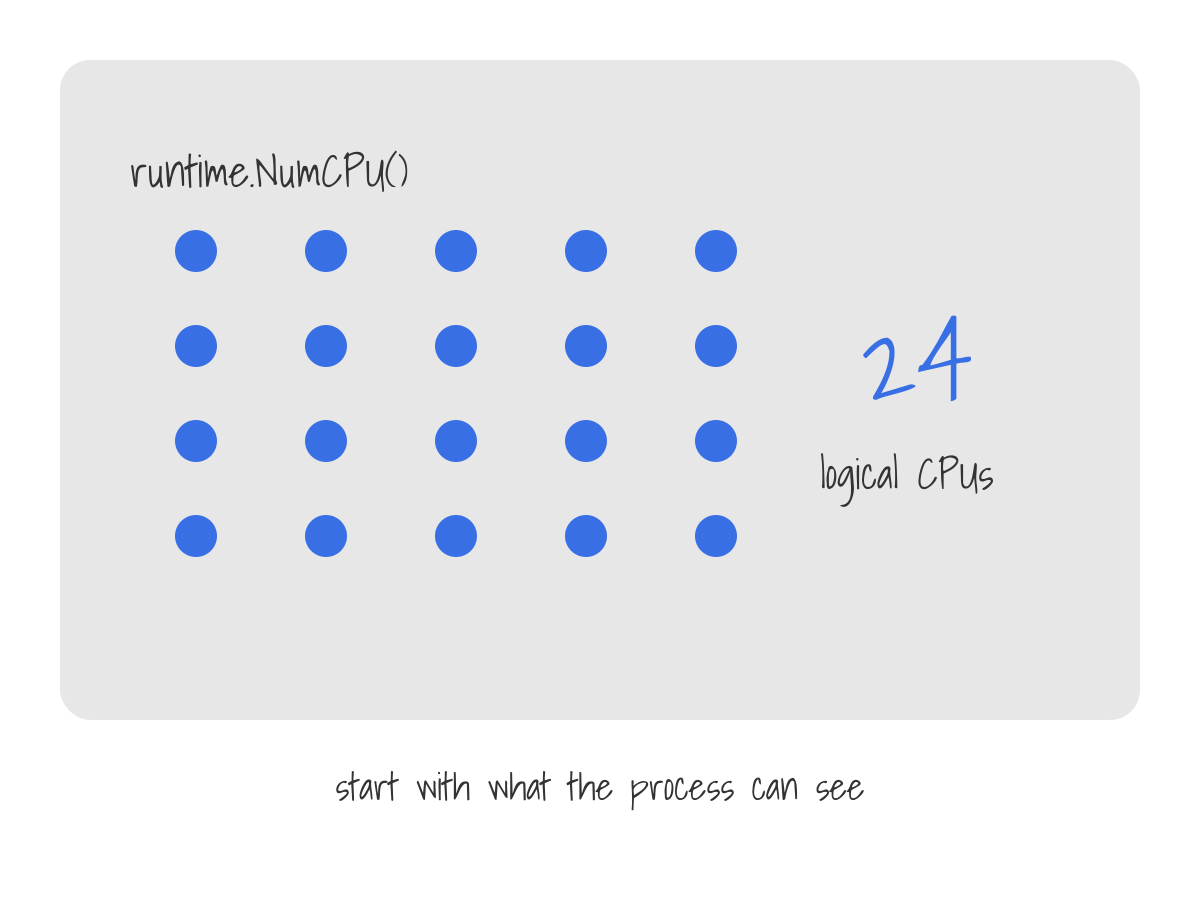 1/3
1/3The process starts on a host with 24 logical CPUs, and
runtime.NumCPU()reports 24.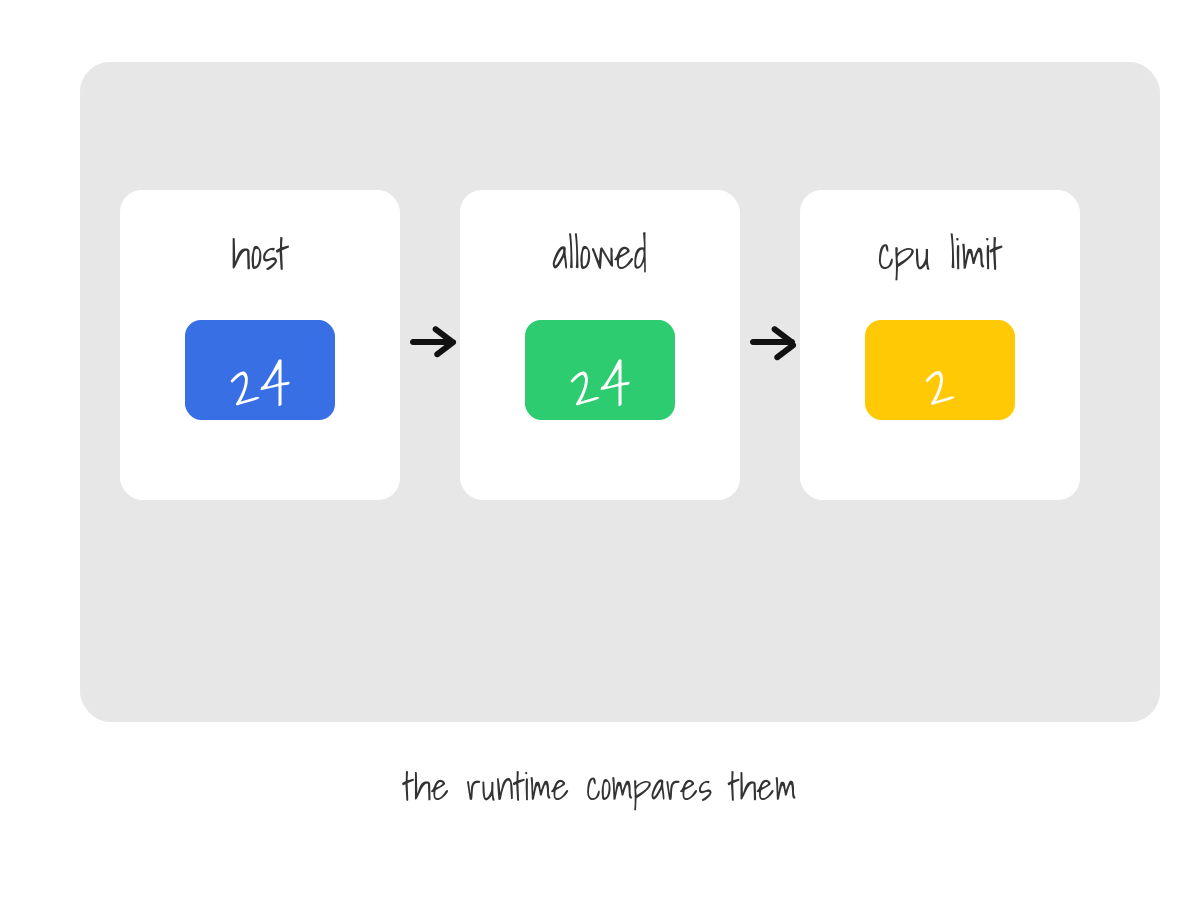 2/3
2/3The runtime also reads the CPUs the process is allowed to use and the container's CPU limit.
cpu.maxreading200000 100000is a two-core limit.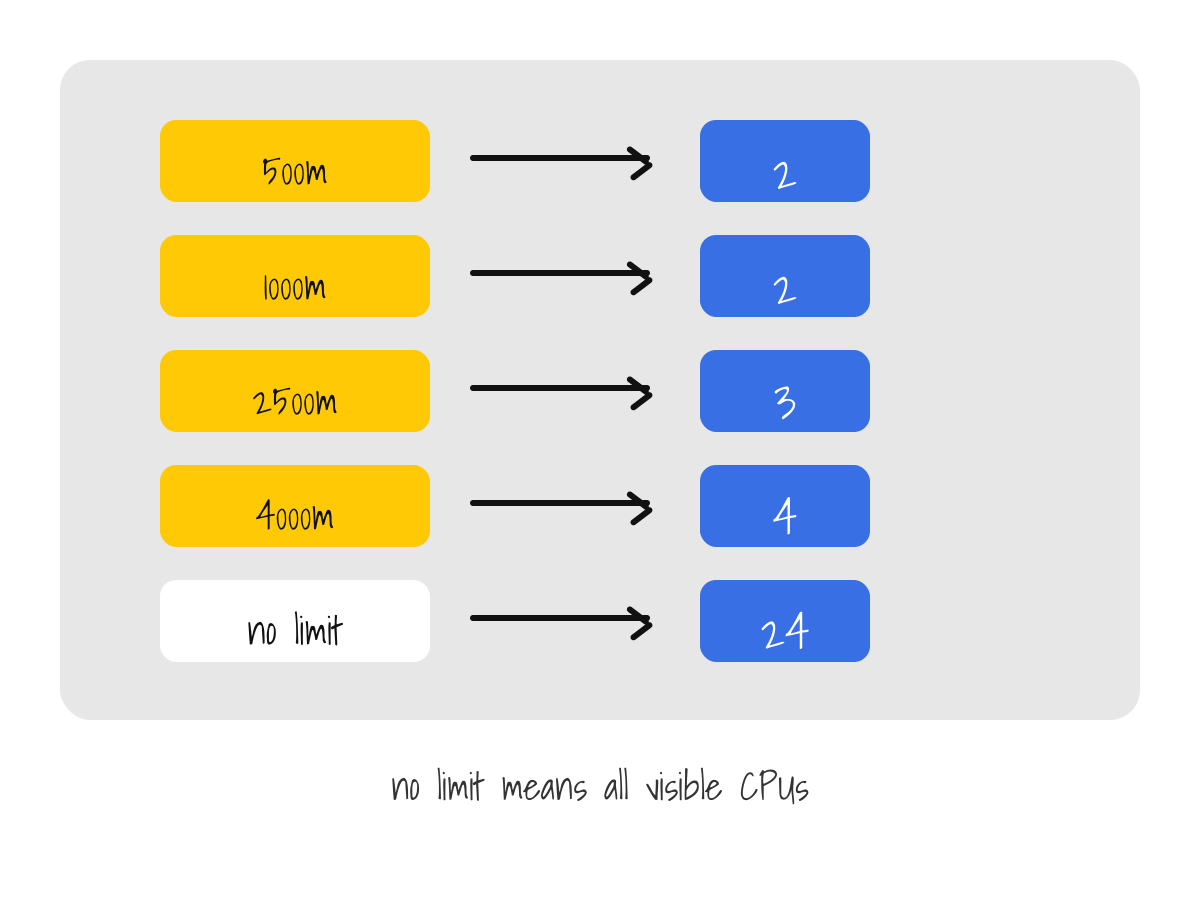 3/3
3/3On this host
500mand1000mboth give 2,2500mgives 3,4000mgives 4, and no limit at all leaves the full 24.
automaxprocs behaves differently by default, rounding a fractional limit down and never going below 1 unless you change its settings.
When the library successfully sets a quota-derived value, that value replaces Go's default and disables automatic updates.
A limit below two cores still produces GOMAXPROCS=2
A 500m limit gives the container about half a core on average. On this host, it produced GOMAXPROCS=2.
With enough runnable goroutines, CPU-bound work uses two threads, spends the quota quickly, and then waits for Linux to refill it.
For a CPU limit less than 1000m, measure throttling and latency before deployment.
To run on a single thread under a small limit, set GOMAXPROCS=1 yourself and measure the latency.
This also disables Go's automatic selection and updates.
Without a CPU limit, Go uses the available CPUs
Without a CPU limit on the container or its parent cgroups, GOMAXPROCS matches the number of CPUs available to the process.
The pod can use idle CPU beyond its request. The runtime does not consider the request when it chooses parallelism.
What happens when the node is busy?
A GOMAXPROCS much higher than the available CPU makes more threads compete for less CPU.
Do a load test with a CPU limit or an explicit GOMAXPROCS.
For a pod with a request and no limit, high parallelism can help during bursts.
Lower parallelism can match the CPU available on a busy node.
Let's compare throughput and p99 latency for both approaches.
The module's Go version and GODEBUG settings control this behavior
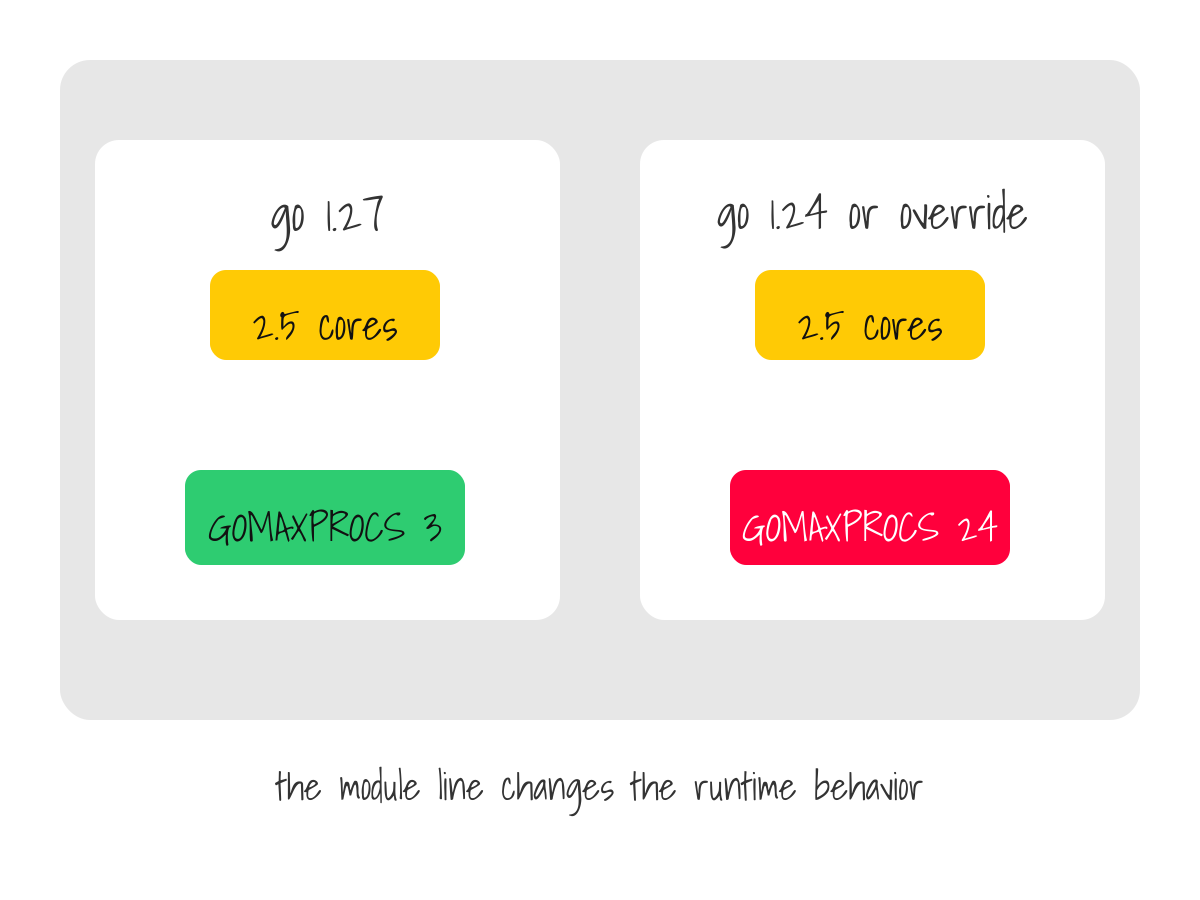
We recompiled the same app with go 1.24 in go.mod and tagged the image as go-requests-limits:go124.
Let's start the new image with a 2.5-core CPU limit:
bash
docker run --rm -d --name go-old-module --cpus=2.5 -p 127.0.0.1:8080:8080 \
  go-requests-limits:go124 >/dev/null
Wait for the health endpoint:
bash
curl --retry 20 --retry-connrefused --retry-delay 1 \
  -sf localhost:8080/health >/dev/null
Compare the cgroup limit with the values Go reports:
bash
curl -s localhost:8080/info | jq '.cpu | {cgroupCPULimit, gomaxprocs, numCPU}'
{
  "cgroupCPULimit": 2.5,
  "gomaxprocs": 24,
  "numCPU": 24
}
The cgroup exposes a 2.5-core limit, but the older module directive keeps GOMAXPROCS at the 24-CPU machine value.
Remove the test container:
bash
docker rm -f go-old-module >/dev/nullThe source code and compiler are the same in both demonstrations: only the module's go directive changes.
Default GODEBUG behavior depends on the compiler version and the Go version declared by the main module or workspace.
Two GODEBUG values control this behavior:
containermaxprocs=0: Ignores the cgroup CPU limit and uses the logical CPU count instead.updatemaxprocs=0: Uses the startup value and disables periodic updates.
Set the GOMAXPROCS environment variable or call runtime.GOMAXPROCS(n) with n > 0 to disable automatic updates.
Calling it with n < 1 only reads the current value.
runtime.SetDefaultGOMAXPROCS restores the default selection and updates, subject to the GODEBUG settings.
The runtime tracks changing limits
Go 1.27 also rechecks the limit while the process runs instead of reading it once at startup.
Start the app with a four-core CPU limit:
bash
docker run --rm -d --name go-resize --cpus=4 -p 127.0.0.1:8080:8080 \
  ghcr.io/learnk8s/go-requests-limits:latest >/dev/null
Wait for the app:
bash
curl --retry 20 --retry-connrefused --retry-delay 1 \
  -sf localhost:8080/health >/dev/null
Read the raw cgroup quota and GOMAXPROCS:
bash
curl -s localhost:8080/info | jq '.cpu | {cgroupCPUMax, gomaxprocs}'
{
  "cgroupCPUMax": "400000 100000",
  "gomaxprocs": 4
}
The cgroup allows 400,000 microseconds of CPU time per 100,000-microsecond period.
That quota equals four cores, so Go selects GOMAXPROCS=4.
Now reduce the running container's CPU limit to one core:
bash
docker update --cpus=1 go-resize >/dev/nullThe runtime checks for cgroup updates periodically. Wait until the app reports the new GOMAXPROCS value:
bash
until [ "$(curl -s localhost:8080/info | jq -r '.cpu.gomaxprocs')" = 2 ]; do
  sleep 0.5
done
Read both values again:
bash
curl -s localhost:8080/info | jq '.cpu | {cgroupCPUMax, gomaxprocs}'

{
  "cgroupCPUMax": "100000 100000",
  "gomaxprocs": 2
}
The quota now allows 100,000 microseconds per 100,000-microsecond period, which equals one core.
Go updates GOMAXPROCS without restarting the process.
Remove the test container:
bash
docker rm -f go-resize >/dev/nullThe limit dropped to one core, but Go selected two execution slots on this host.
The update is not instant because the runtime checks for updates up to once per second and less often while idle.
This matters for in-place pod resize, where CPU resources change without a restart.
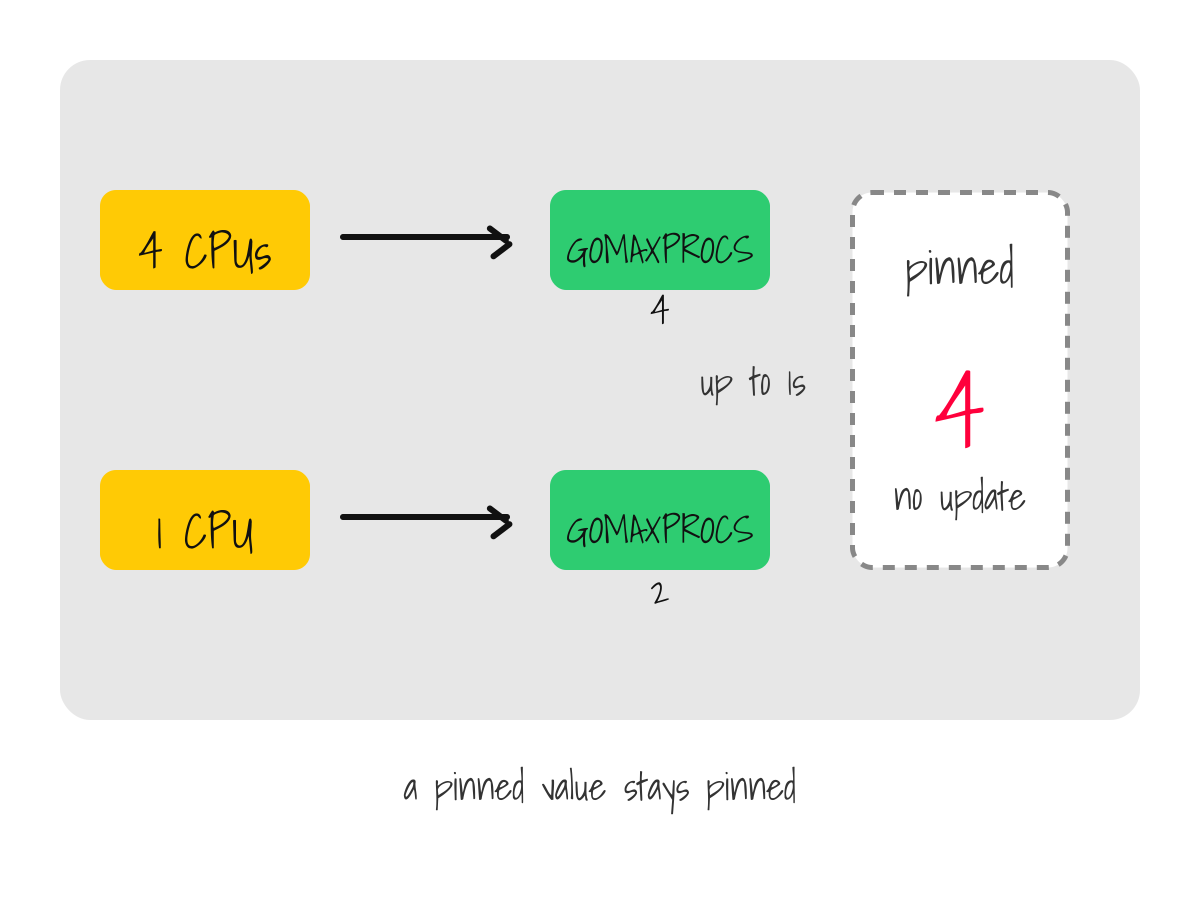
A default Go 1.27 service follows the new limit, and a service with GOMAXPROCS pinned by hand stays where it was.
CPU limits are shared budgets
Linux enforces a container's CPU limit as a shared budget of CPU time that refills on a schedule.
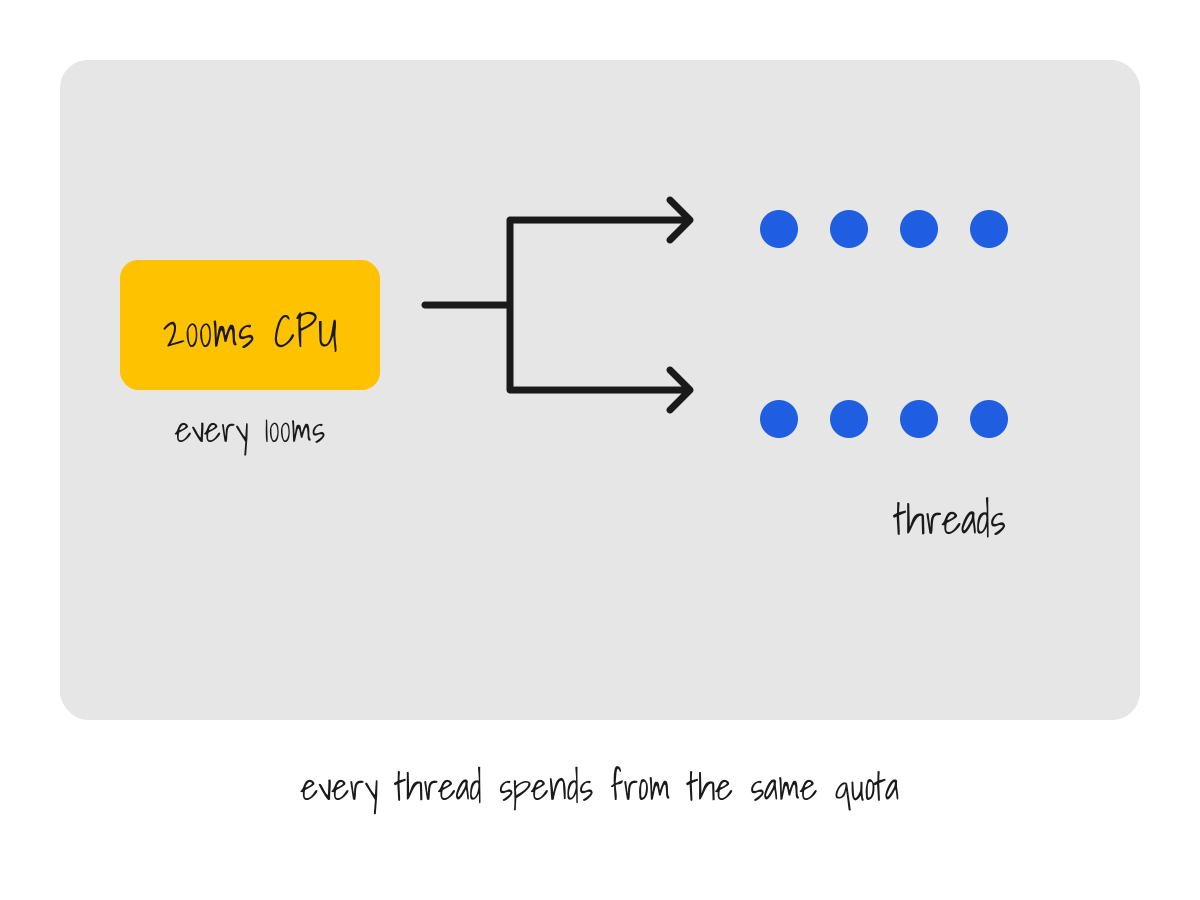
The kernel implements it through cpu.max: with limits.cpu: 2000m and a 100ms period, all threads together get 200ms of CPU time per period.
Once the budget runs out, everything ready to run waits for the next period.
Does it matter how many threads spend that budget?
GOMAXPROCS limits parallel Go execution.
The container's quota covers all CPU time charged to it, including C code and system calls.
Let's explore the /cpu endpoint that runs 20 busy goroutines for five seconds in a container with a two-core CPU limit.
It measures throughput by counting completed loop operations.
First, start the app with the container-aware default and a two-core CPU limit:
bash
docker run --rm -d --name go-cpu --cpus=2 -p 127.0.0.1:8080:8080 \
  ghcr.io/learnk8s/go-requests-limits:latest >/dev/null
Wait until the app is ready:
bash
curl --retry 20 --retry-connrefused --retry-delay 1 \
  -sf localhost:8080/health >/dev/null
Run 20 busy goroutines for five seconds:
bash
curl -s 'localhost:8080/cpu?seconds=5&workers=20'
{
  "gomaxprocs": 2,
  "numCPU": 24,
  "busyGoroutines": 20,
  "cancelled": false,
  "elapsedSeconds": 5.01,
  "processCPUSeconds": 10.01,
  "effectiveCores": 2,
  "operations": 8129900000,
  "operationsPerSecond": 1621363571,
  "timerWakeLatenessMs": { "p50": 10.92, "p99": 25.74, "max": 44.63 },
  "probeSamples": 1000,
  "totalPeriods": 50,
  "throttledPeriods": 22,
  "throttledUsec": 27705
}
Go selected GOMAXPROCS=2 for the two-core limit. The 20 goroutines share those two execution slots.
Remove the first container:
bash
docker rm -f go-cpu >/dev/nullNow disable the container-aware default with GODEBUG=containermaxprocs=0 while keeping the same two-core limit:
bash
docker run --rm -d --name go-cpu-old --cpus=2 \
  -e GODEBUG=containermaxprocs=0 \
  -p 127.0.0.1:8080:8080 \
  ghcr.io/learnk8s/go-requests-limits:latest >/dev/null
Wait until the second container is ready:
bash
curl --retry 20 --retry-connrefused --retry-delay 1 \
  -sf localhost:8080/health >/dev/null
Run the same workload:
bash
curl -s 'localhost:8080/cpu?seconds=5&workers=20'
{
  "gomaxprocs": 24,
  "numCPU": 24,
  "busyGoroutines": 20,
  "cancelled": false,
  "elapsedSeconds": 5.09,
  "processCPUSeconds": 10.22,
  "effectiveCores": 2.01,
  "operations": 5587200000,
  "operationsPerSecond": 1097554363,
  "timerWakeLatenessMs": { "p50": 6.88, "p99": 88.64, "max": 97.03 },
  "probeSamples": 1000,
  "totalPeriods": 51,
  "throttledPeriods": 51,
  "throttledUsec": 92309768
}
Go now uses the machine's 24-CPU count for GOMAXPROCS, although the container still has only two cores of CPU time.
Remove the second container:
bash
docker rm -f go-cpu-old >/dev/nullMore Go threads did not increase the container's CPU quota.
Both runs used about two cores.
Yet throughput fell from 1.62 billion loop operations per second with GOMAXPROCS=2 to 1.10 billion with GOMAXPROCS=24.
The app also runs a small timer task alongside the busy workers to see whether they delay other work.
Its p99 lateness increased from about 26ms to 89ms.
The reason is straightforward: more threads can exhaust the same CPU budget sooner and work must then wait for the next quota period.
 1/4
1/4limits.cpu: 2000mbecomes a shared budget: every thread in the container draws from 200ms of CPU time in each 100ms period.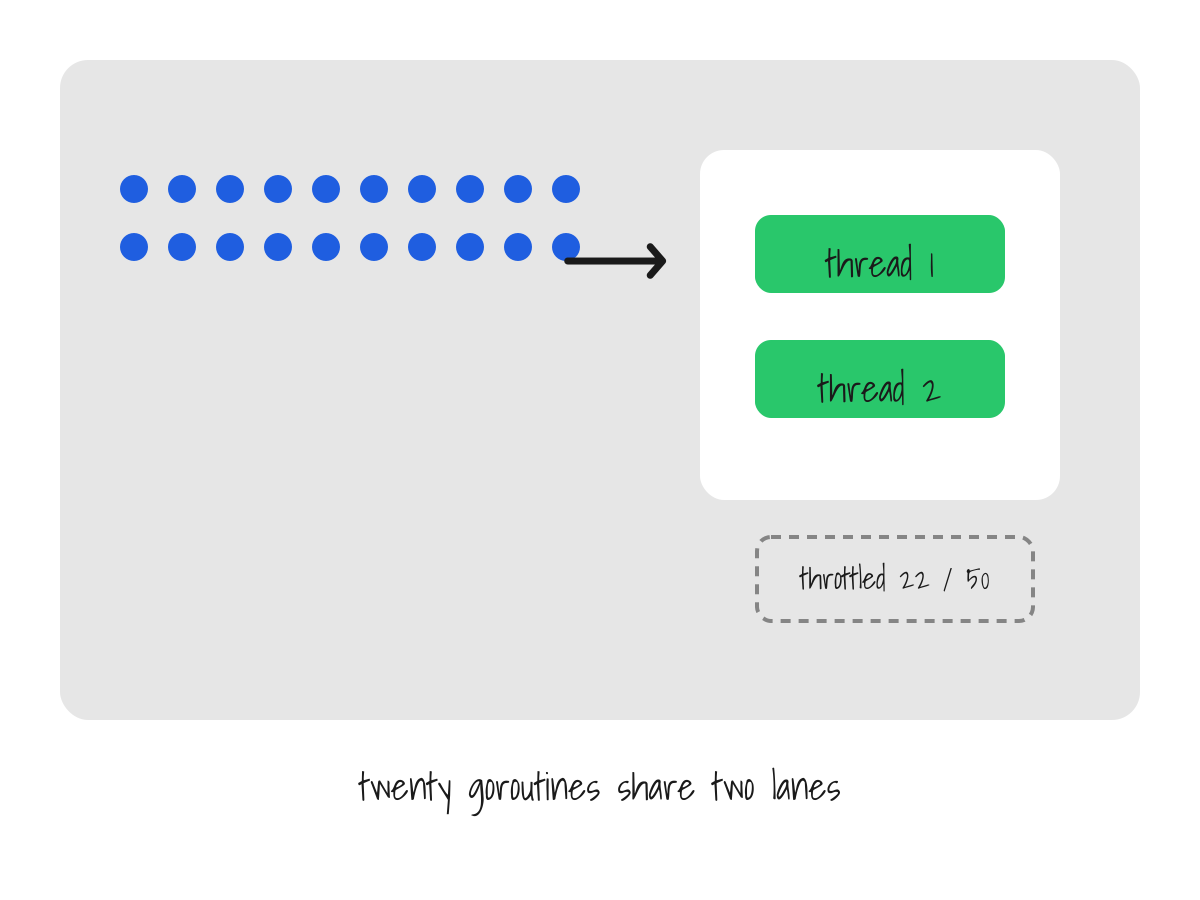 2/4
2/4With the container-aware default of
GOMAXPROCS=2, 20 busy goroutines share two execution slots, spend 10.01 CPU-seconds in five seconds, and are throttled in 22 of 50 periods.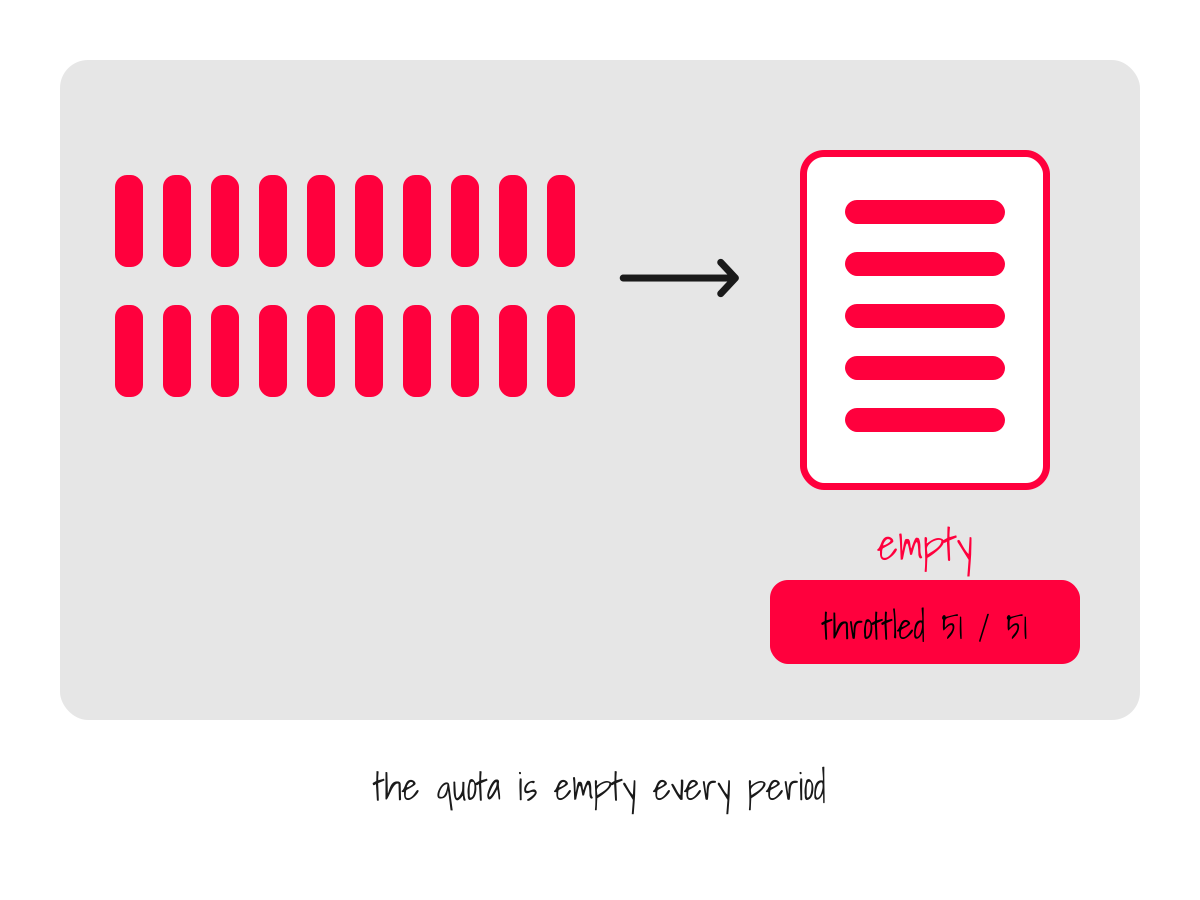 3/4
3/4With
GODEBUG=containermaxprocs=0andGOMAXPROCS=24, the same 20 busy goroutines spend 10.22 CPU-seconds and are throttled in all 51 measured periods.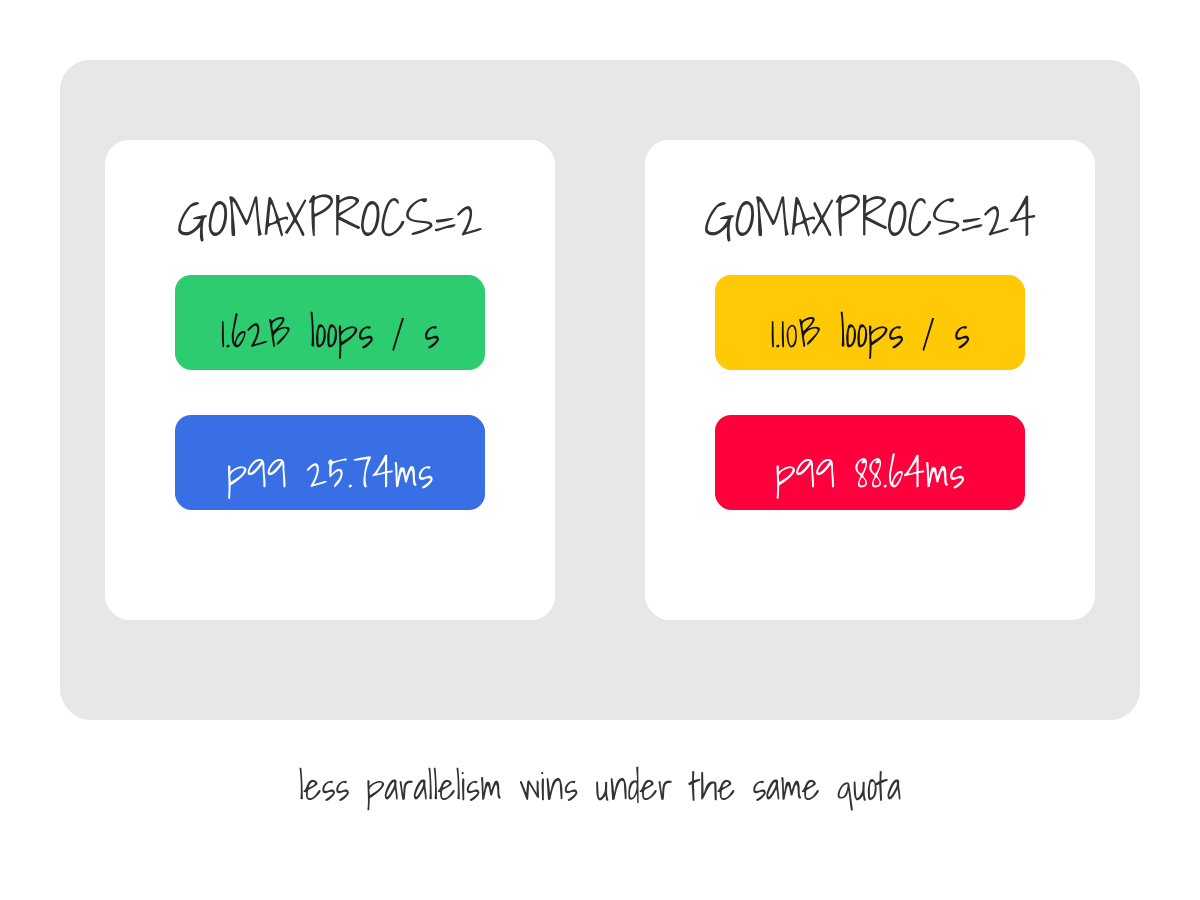 4/4
4/4Similar CPU time, different results: 1.62 billion loop operations per second against 1.10 billion, and a p99 timer wake lateness of 25.74ms against 88.64ms.
Removing the CPU limit changes the results.
The same 20 busy goroutines used 99.75 CPU-seconds in five seconds, about 19.95 cores, with no container throttling.
Go memory is more than the live heap
The runtime tracks a Go container's memory in several separate areas, and runtime/metrics reports each one:
- Heap objects (
/memory/classes/heap/objects:bytes): Live objects plus dead objects the collector has not freed yet. - Live heap (
/gc/heap/live:bytes): Memory occupied by objects marked by the previous GC. It sets the next heap target, and it is not an instant reachability measurement. - Heap free and unused: Heap memory Go can reuse right away, along with reserved heap space no object occupies.
- Heap released (
/memory/classes/heap/released:bytes): Virtual address space Go still reserves after handing its physical memory back to the operating system. - Heap stacks (
/memory/classes/heap/stacks:bytes): Memory set aside for goroutine stacks. In a non-cgo binary like this demo, it also covers OS thread stacks. - OS stacks (
/memory/classes/os-stacks:bytes): Stack memory the operating system allocates. Some cgo thread stacks fall outside it, and in this non-cgo demo the value is zero. - Runtime metadata and other: Internal structures for managing heap memory, profiling, and other runtime bookkeeping.
- Memory outside Go's metrics: The executable, memory taken directly with
mmapor cgo, cached file data, and network buffers, all counting against the container limit.
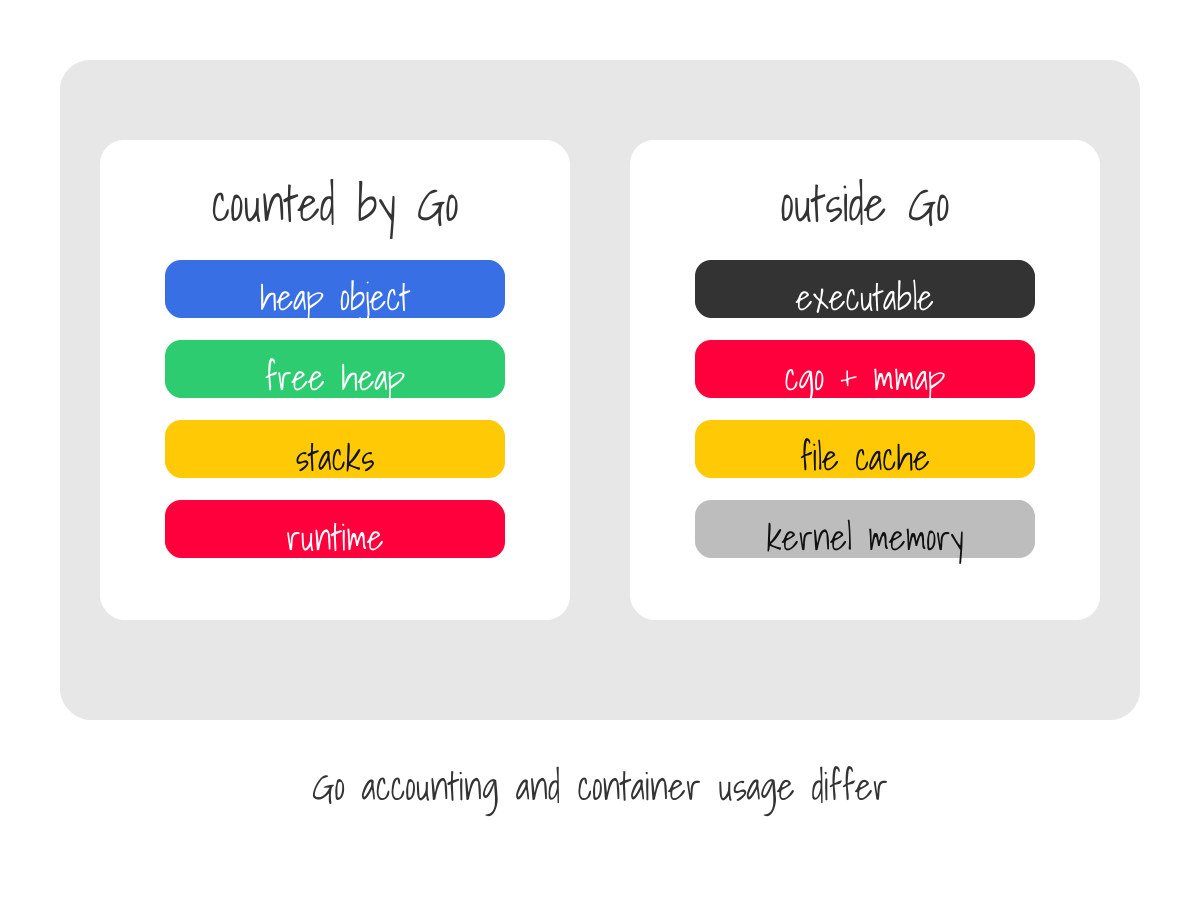
The memory that counts toward GOMEMLIMIT is /memory/classes/total:bytes minus /memory/classes/heap/released:bytes.
Released heap remains part of the process's virtual address space, and it stops counting toward the soft limit.
The demo reports that figure as runtimeAccountedMi, next to the process resident set size (RSS) and the container's memory.current.
Start the app with a 512MiB container limit and a 460MiB Go memory limit:
bash
docker run --rm -d --name go-heap \
  --memory=512m --memory-swap=512m --cpus=2 \
  -e GOMEMLIMIT=460MiB \
  -p 127.0.0.1:8080:8080 \
  ghcr.io/learnk8s/go-requests-limits:latest >/dev/null
Wait until the app is ready:
bash
curl --retry 20 --retry-connrefused --retry-delay 1 \
  -sf localhost:8080/health >/dev/null
Ask the app to allocate and retain 150MiB on the Go heap.
The endpoint returns a snapshot after the allocation:
bash
curl -s 'localhost:8080/heap?mb=150&hold=true' | jq .after
{
  "runtimeTotalMi": 160.31,
  "runtimeAccountedMi": 155.76,
  "lastGCLiveHeapMi": 116.16,
  "heapGoalMi": 232.53,
  "heapObjectsMi": 150.15,
  "heapFreeMi": 0.41,
  "heapUnusedMi": 0.61,
  "heapReleasedMi": 4.55,
  "goroutineStacksMi": 0.28,
  "osStacksMi": 0,
  "otherRuntimeMi": 4.31,
  "rssMi": 159.85,
  "cgroupMemoryCurrentMi": 156.26
}
Remove the test container:
bash
docker rm -f go-heap >/dev/nullEach of these four numbers describes a different quantity.
The previous GC found 116Mi live, and heap objects hold 150Mi at the snapshot.
Go counts 156Mi toward GOMEMLIMIT, and the container's own counter also reports about 156Mi.
memory.current reports memory charged to the cgroup, including kernel memory and cached file data.
It measures a different quantity from process RSS and Go's accounting.
These values are close here. The later stack and direct-allocation experiments separate them by hundreds of MiB.
The runtime reserves large virtual address ranges that hold no physical memory.
Thus, virtual memory size (VSS) is not useful for sizing a 64-bit Go pod.
VSS can still help you find exhausted address space or unreleased mappings, especially on 32-bit systems.
The container limit is a hard stop, but GOMEMLIMIT is just a target
Without a runtime memory limit, GOGC alone sets the heap target: live heap + (live heap + memory scanned in goroutine stacks and global variables) * GOGC / 100.
That formula does not account for limits.memory.
In this run, a workload holds 260Mi in a 512Mi container and then allocates short-lived objects until Linux kills it:
bash
docker run -d --name go-no-memlimit \
  --memory=512m --memory-swap=512m --cpus=2 \
  -p 127.0.0.1:8080:8080 \
  ghcr.io/learnk8s/go-requests-limits:latest >/dev/null
Wait for the health endpoint:
bash
curl --retry 20 --retry-connrefused --retry-delay 1 \
  -sf localhost:8080/health >/dev/null
Retain 260MiB on the heap and read the memory snapshot:
bash
curl -s 'localhost:8080/heap?mb=260&hold=true' | \
  jq -c '.after | {lastGCLiveHeapMi, heapGoalMi, runtimeAccountedMi, rssMi, cgroupMemoryCurrentMi}'
{"lastGCLiveHeapMi":232.16,"heapGoalMi":464.54,"runtimeAccountedMi":266.04,"rssMi":268.9,"cgroupMemoryCurrentMi":265.64}
Allocate short-lived objects for five seconds:
bash
curl -s 'localhost:8080/churn?seconds=5&kb=64' -o /dev/null -w 'http=%{http_code}\n'
http=000
Wait for the container to stop:
bash
docker wait go-no-memlimit >/dev/nullThe churn request returns no response.
Inspect the container's termination state:
bash
docker inspect -f 'OOMKilled={{.State.OOMKilled}} ExitCode={{.State.ExitCode}}' go-no-memlimit

OOMKilled=true ExitCode=137
Read the container log:
bash
docker logs go-no-memlimit

2026/10/05 07:50:24 listening on port 8080
Remove the test container:
bash
docker rm go-no-memlimit >/dev/nullThe log ends at the startup line; there is nothing after the kill.
If the container reaches its memory limit with nothing left to reclaim, Linux sends the process a SIGKILL.
The process cannot catch that signal, print a stack trace, or run cleanup code.
A soft limit changes the outcome for the same workload:
bash
docker run -d --name go-memlimit \
  --memory=512m --memory-swap=512m --cpus=2 \
  -e GOMEMLIMIT=460MiB \
  -p 127.0.0.1:8080:8080 \
  ghcr.io/learnk8s/go-requests-limits:latest >/dev/null
Wait for the health endpoint:
bash
curl --retry 20 --retry-connrefused --retry-delay 1 \
  -sf localhost:8080/health >/dev/null
Retain the same 260MiB on the heap:
bash
curl -s 'localhost:8080/heap?mb=260&hold=true' -o /dev/nullRun the same allocation workload:
bash
curl -s 'localhost:8080/churn?seconds=5&kb=64' | jq '.memory | {runtimeAccountedMi, cgroupMemoryCurrentMi}'

{
  "runtimeAccountedMi": 454.54,
  "cgroupMemoryCurrentMi": 441.5
}
Remove the test container:
bash
docker rm -f go-memlimit >/dev/nullThe service finishes the run, with Go counting about 455Mi toward the 460MiB soft limit.
At the final snapshot, memory.current reports about 442Mi.
GOMEMLIMIT is a soft limit on memory managed by the runtime. It does not cap the process or the container.
Two ways a Go pod runs out of memory
The kernel enforces the container limit.
If Linux cannot reclaim enough cached or unused memory, it kills one or more processes.
The collector tries to stay within the soft limit and it runs more often as memory approaches GOMEMLIMIT.
When that is still not enough, the runtime crosses the soft limit rather than stalling the program forever.
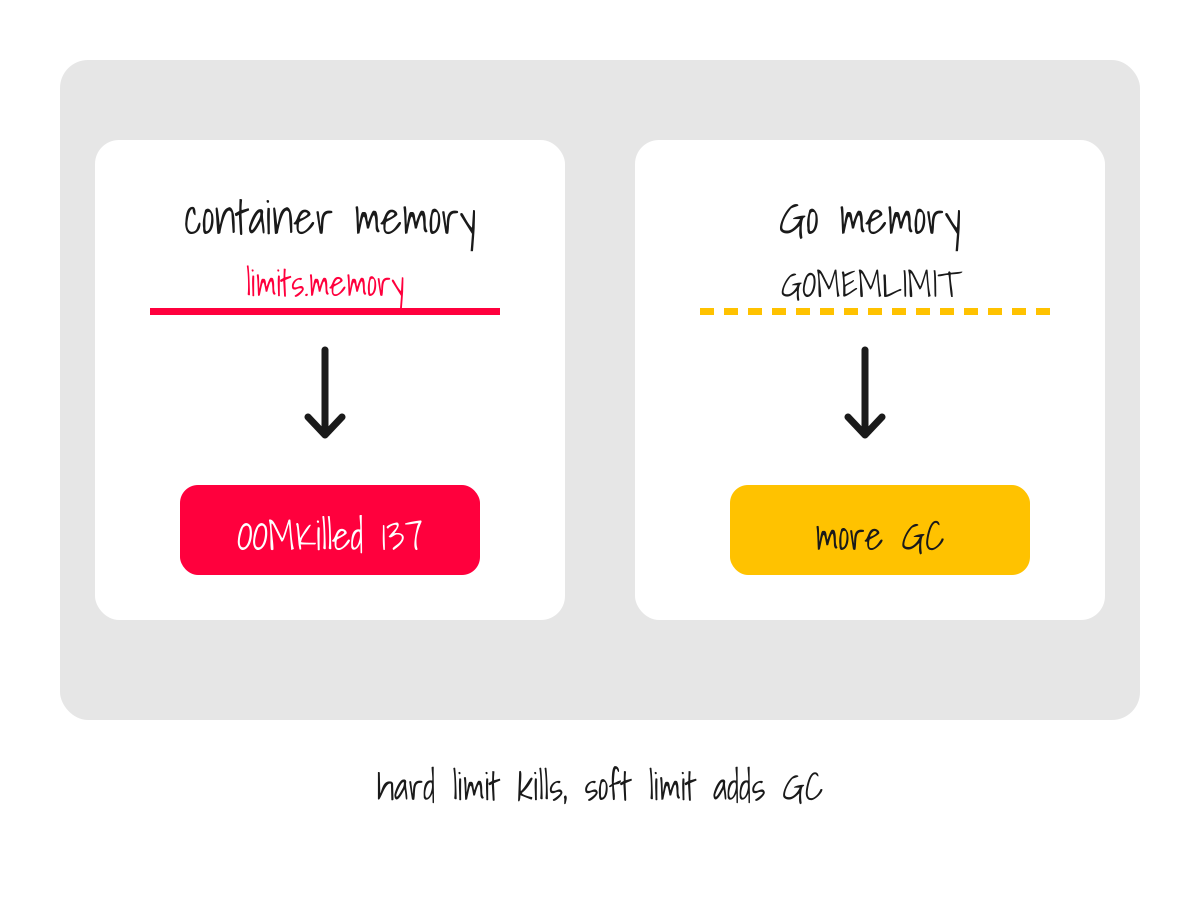
Pressure on Go-managed memory shows up as higher GC CPU and higher latency, often with no useful application log at all.
Memory outside Go's accounting can approach the container limit without a corresponding increase in GC activity.
What if the service normally uses nearly all of its container memory?
Then GOMEMLIMIT is the wrong tool, because setting it there can cause severe slowdowns without removing the risk of running out of memory.
A service that needs 500Mi in a 512Mi container needs a bigger container or less live memory.
Lowering the soft limit creates no capacity.
GOGC sets the pace until the memory limit takes over
GOGC controls how much heap growth Go aims to allow between collections.
GOMEMLIMIT can lower the heap goal when that growth does not fit Go's soft memory budget.
Less space for new objects means more frequent collections.
And those collections use CPU time, so memory savings can reduce throughput or increase latency.
To test this, let's set GOMEMLIMIT=460MiB but give the container 1GiB.
The extra headroom lets us study GC behavior rather than a container OOM kill.
Each run keeps a different amount of heap in use and then allocates short-lived 64KiB objects for five seconds.
Start the first container:
bash
docker run --rm -d --name go-churn \
  --memory=1g --memory-swap=1g --cpus=2 \
  -e GOMEMLIMIT=460MiB \
  -p 127.0.0.1:8080:8080 \
  ghcr.io/learnk8s/go-requests-limits:latest >/dev/null
Retain 100MiB on the heap:
bash
curl --retry 20 --retry-connrefused --retry-delay 1 -sf \
  'localhost:8080/heap?mb=100&hold=true' -o /dev/null
Run the allocation workload:
bash
curl -s 'localhost:8080/churn?seconds=5&kb=64' | jqThe response includes the live heap, heap goal, GC cycle count, and total allocated bytes.
Remove the container after the run:
bash
docker rm -f go-churn >/dev/nullRepeat these steps in a fresh container with mb=260, mb=390, and mb=410 in the /heap request.
Here are the results:
| Held heap | Live heap | Heap goal | GC cycles / GiB allocated |
|---|---|---|---|
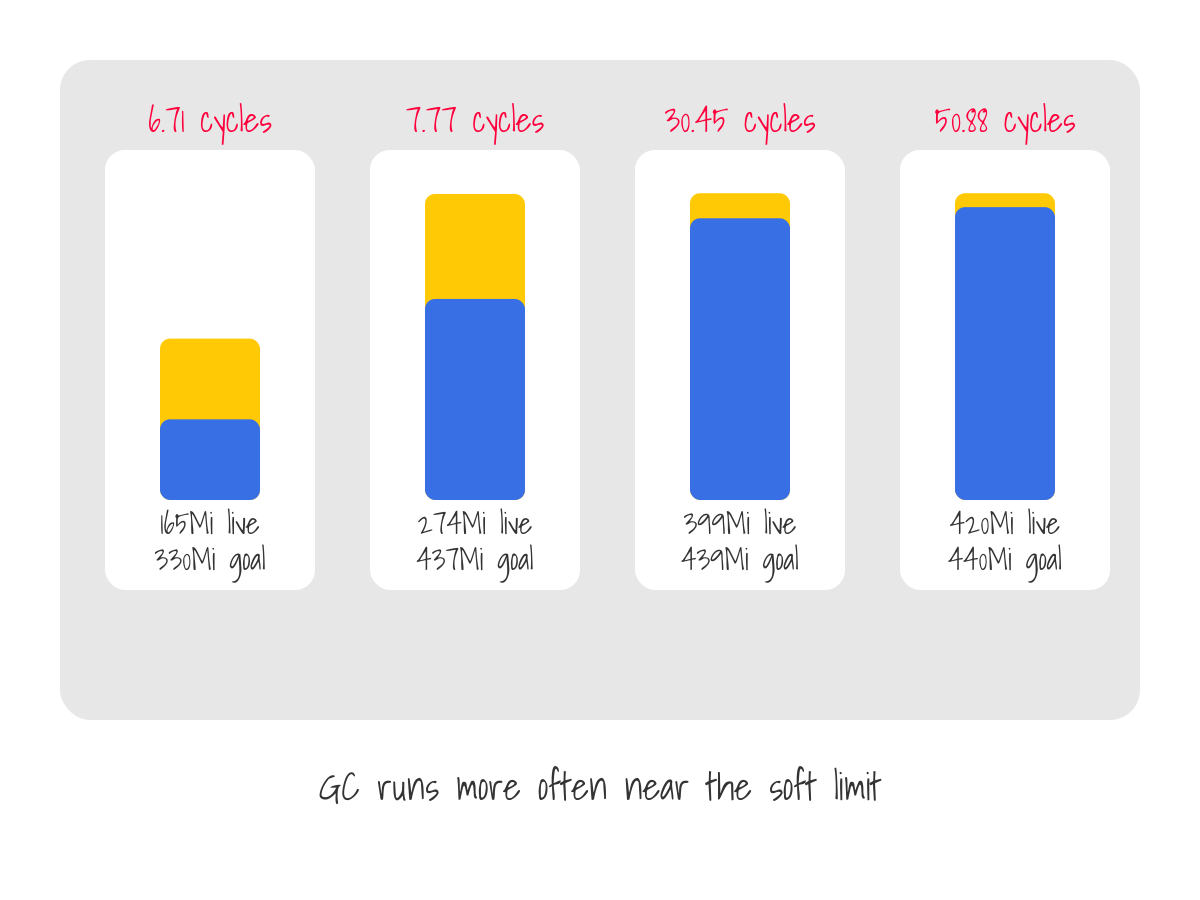
| 100Mi | 165Mi | 330Mi | 6.71 |
| 260Mi | 274Mi | 437Mi | 7.77 |
| 390Mi | 399Mi | 439Mi | 30.45 |
| 410Mi | 420Mi | 440Mi | 50.88 |
We use cycles per GiB because the runs allocated different amounts of memory.
The first run's heap goal is roughly twice its live heap: 165Mi to 330Mi.
That is normal GOGC=100 behavior for this workload.
In the last three runs, the memory limit keeps the heap goal near 440Mi.
More live data leaves less space for new objects, so Go collects more often per GiB allocated.
The app still needs the data it holds: the memory limit makes Go reclaim short-lived objects more often, not use less live memory.
Can you subtract the live heap from GOMEMLIMIT to find the room you have left?
But that calculation is misleading!
Stacks, runtime bookkeeping, and reusable heap space all count toward the soft limit.
Does a lower GOMEMLIMIT make things safer?
Not by itself.
A lower limit can increase GC CPU usage and reduce throughput or increase latency.
It also does not stop Linux from killing the process when Go crosses the soft limit or when untracked memory fills the rest of the budget.
The collector cannot free memory that is still in use, and no setting creates space a workload already needs.
But there is one documented option where you turn GOGC off and let the memory limit alone decide when GC runs, because the memory limit still applies with GOGC=off.
Let's compare the default settings with GOGC=off, start a new container as before and retain 100MiB.
This time, allocate 32KiB objects:
bash
curl -s 'localhost:8080/churn?seconds=5&kb=32' | jqRemove the container before the second run:
bash
docker rm -f go-churn >/dev/nullStart another container with the same memory budget, but turn GOGC off:
bash
docker run --rm -d --name go-gogc-off \
  --memory=1g --memory-swap=1g --cpus=2 \
  -e GOMEMLIMIT=460MiB \
  -e GOGC=off \
  -p 127.0.0.1:8080:8080 \
  ghcr.io/learnk8s/go-requests-limits:latest >/dev/null
Retain the same 100MiB of heap:
bash
curl --retry 20 --retry-connrefused --retry-delay 1 -sf \
  'localhost:8080/heap?mb=100&hold=true' -o /dev/null
Run the same allocation workload:
bash
curl -s 'localhost:8080/churn?seconds=5&kb=32' | jqRemove the test container:
bash
docker rm -f go-gogc-off >/dev/null| Setting | GC cycles | Go-counted memory | Allocations per second |
|---|---|---|---|
GOGC default | 1,026 | About 380Mi | About 999,000 |
GOGC=off | 532 | About 411Mi | About 866,000 |
Fewer collections did not make this workload faster. In this test, GOGC=off used more memory and allocated more slowly than the default.
With GOGC=off, Go relies on GOMEMLIMIT as the main trigger for garbage collection.
A busy app can keep more memory between collections and that leaves less for other programs that share the same memory budget.
GOMEMLIMIT does not cover memory allocated outside Go
Memory allocated outside the Go runtime never enters its soft-limit accounting, and it counts toward the container limit all the same.
The /offheap endpoint gets memory directly from the operating system with syscall.Mmap and writes to every page.
Those writes make the mapped pages resident:
bash
docker run -d --name go-offheap \
  --memory=512m --memory-swap=512m --cpus=2 \
  -e GOMEMLIMIT=400MiB \
  -p 127.0.0.1:8080:8080 \
  ghcr.io/learnk8s/go-requests-limits:latest >/dev/null
Wait for the health endpoint:
bash
curl --retry 20 --retry-connrefused --retry-delay 1 \
  -sf localhost:8080/health >/dev/null
Retain 150MiB on the Go heap:
bash
curl -s 'localhost:8080/heap?mb=150&hold=true' -o /dev/nullAllocate 100MiB outside Go's memory accounting:
bash
curl -s 'localhost:8080/offheap?mb=100' | jq .afterRepeat the command twice more.
Each call adds another 100MiB, with these results:
| Direct allocations | Go-counted memory | RSS | Container memory |
|---|---|---|---|
| 100Mi | 155.95Mi | 260.61Mi | 256.96Mi |
| 200Mi | 155.97Mi | 360.55Mi | 357.16Mi |
| 300Mi | 155.97Mi | 460.48Mi | 456.88Mi |
The fourth call gets no HTTP response:
bash
curl -s 'localhost:8080/offheap?mb=100' -o /dev/null -w 'http=%{http_code}\n'
http=000
Wait for the container to stop:
bash
docker wait go-offheap >/dev/nullGo's accounting stays near 156Mi as direct allocations reach 300Mi.
RSS and total container memory increase by about 100Mi per call.
The fourth call gets no response.
Let's inspect the container's termination state:
bash
docker inspect -f 'OOMKilled={{.State.OOMKilled}} ExitCode={{.State.ExitCode}}' go-offheap

OOMKilled=true ExitCode=137
Remove the test container:
bash
docker rm go-offheap >/dev/nullThe direct allocations added nothing to the memory counted toward GOMEMLIMIT.
Go metrics on their own can look healthy while the container is about to be killed.
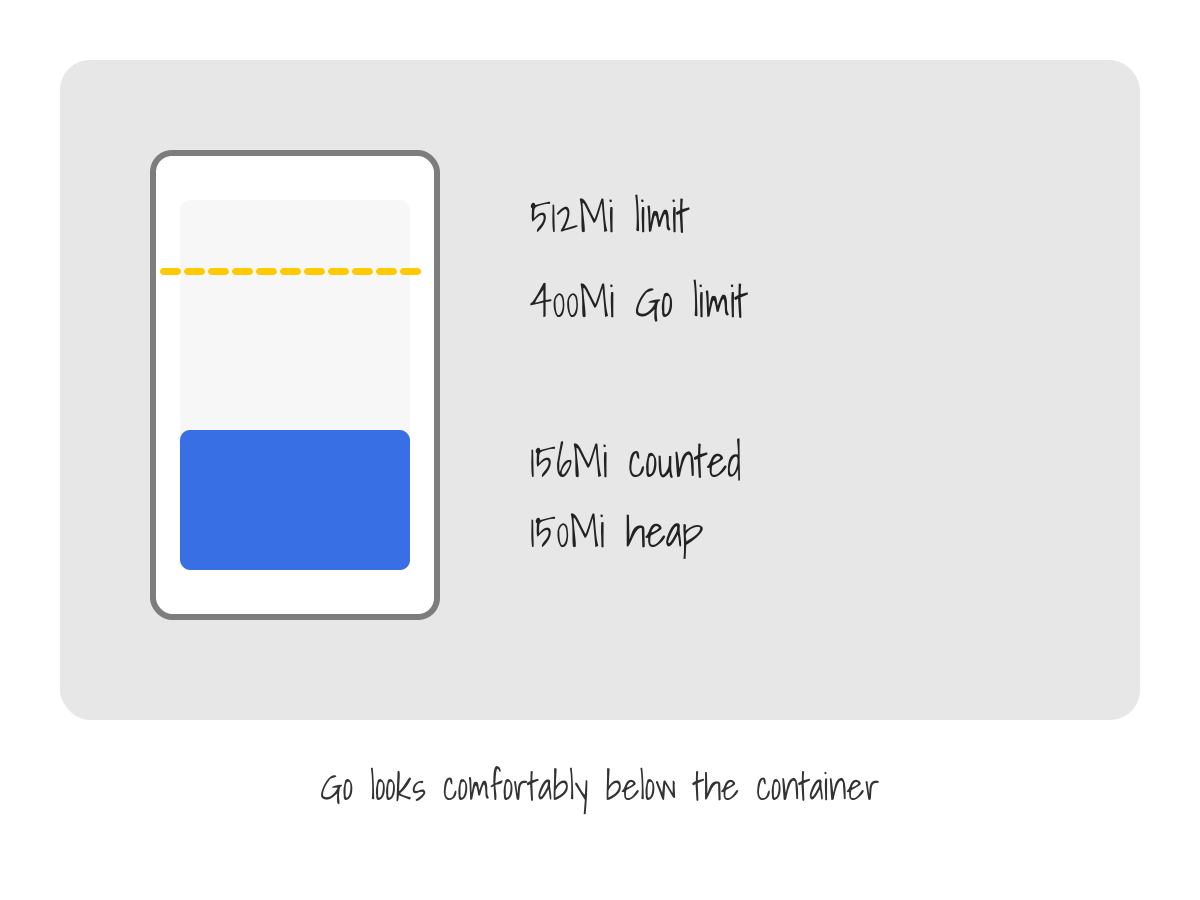 1/4
1/4The container has a 512Mi memory limit and
GOMEMLIMIT=400MiB, and 150Mi of held heap puts the memory Go counts at about 156Mi.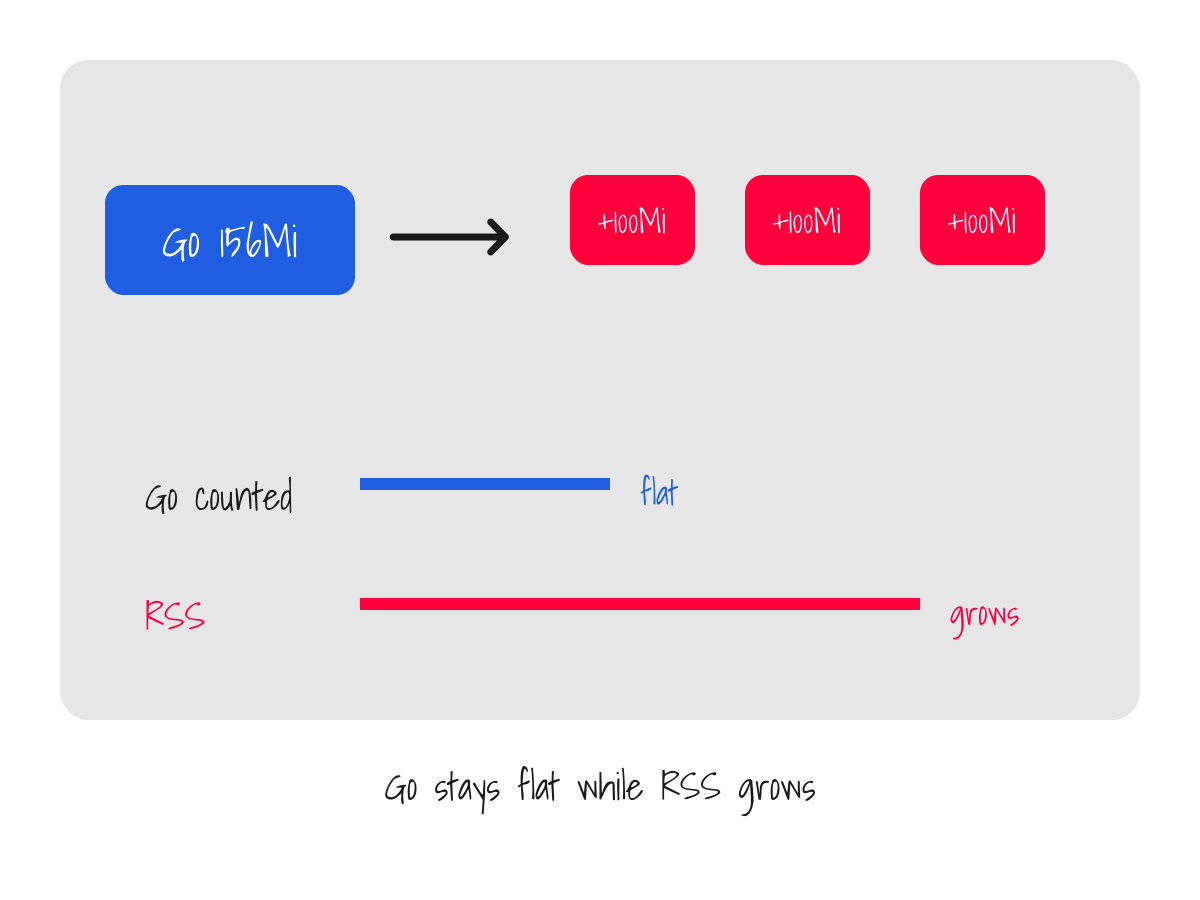 2/4
2/4Each
/offheap?mb=100call maps 100Mi withsyscall.Mmapand writes to every page, which turns the mapping into resident memory.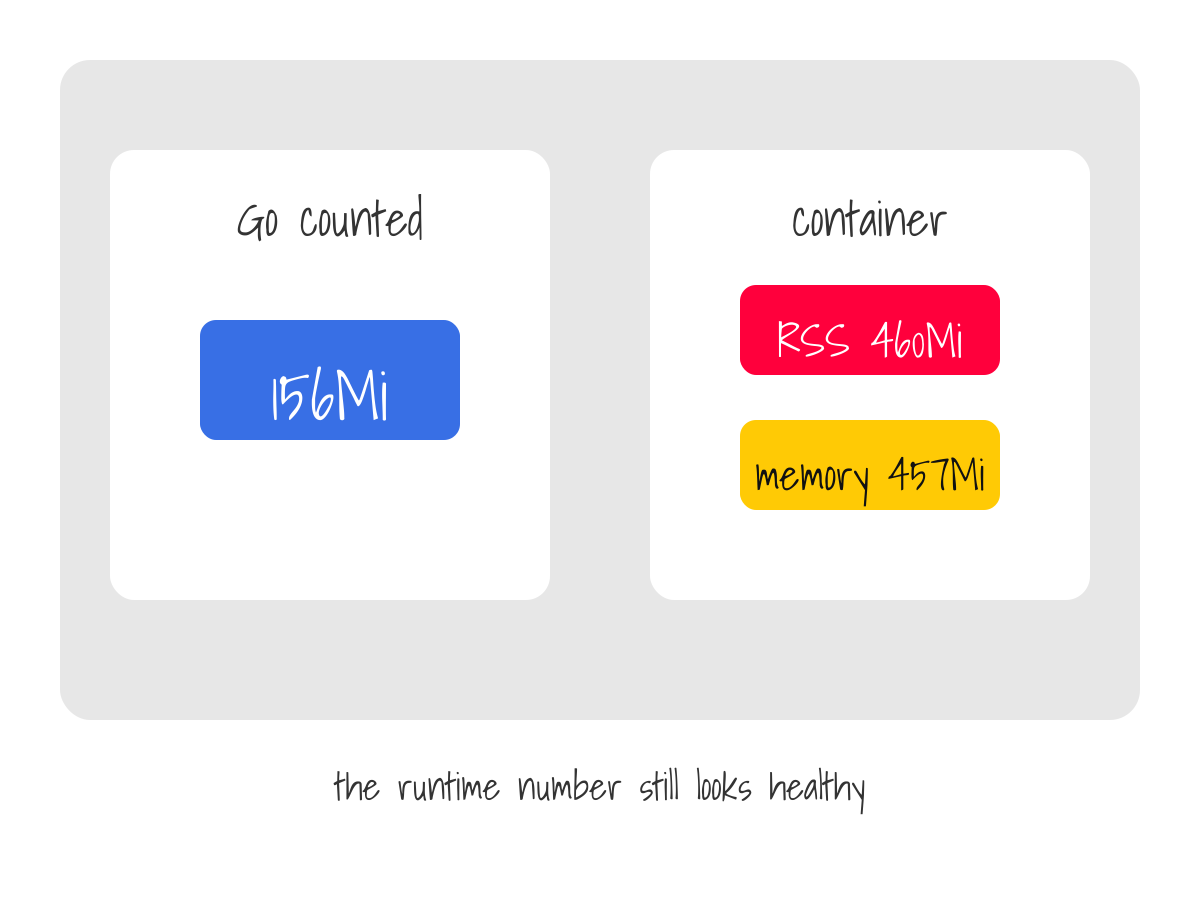 3/4
3/4After three calls Go still counts about 156Mi, while RSS reaches 460Mi and the container's own counter reads 457Mi.
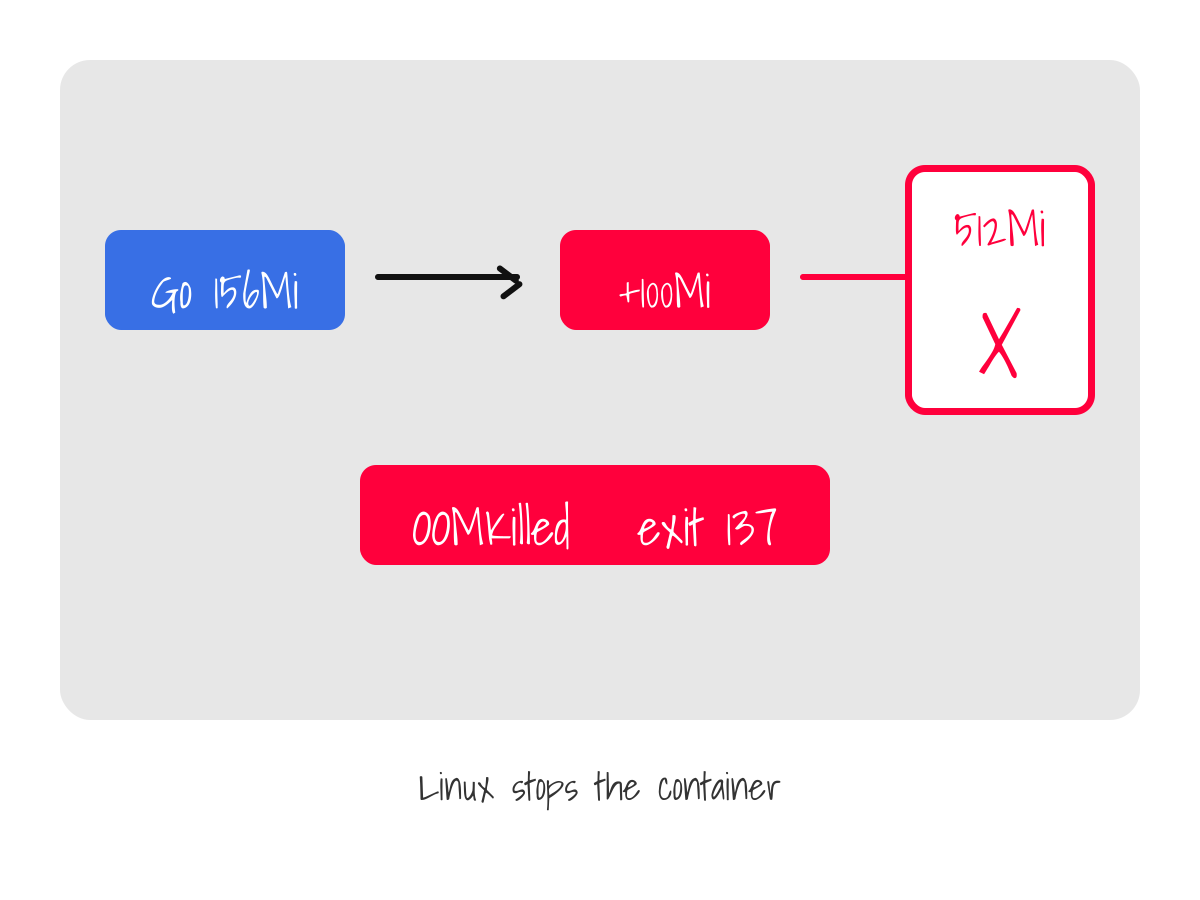 4/4
4/4The fourth call never returns:
OOMKilled=trueand exit code 137. The previous three responses kept Go's accounting near 156Mi.
Services that use cgo can adjust the memory limit at runtime as external memory moves, and that needs application logic to track the external memory and update GOMEMLIMIT as it changes.
What about the memory that Go tracks, but people often forget to count?
Active goroutine stacks use runtime memory
Every goroutine starts with a small stack, and /gc/stack/starting-size:bytes reports that starting size.
Go grows a goroutine's stack whenever the frames need more room.
Stacks count toward GOMEMLIMIT, and the parts the collector scans raise the heap target that GOGC sets.
A live stack can shrink during GC, but it never shrinks below the frames still in use.
The /goroutines endpoint asks for eight recursive frames of about 1KiB each.
Go grows stacks in larger steps.
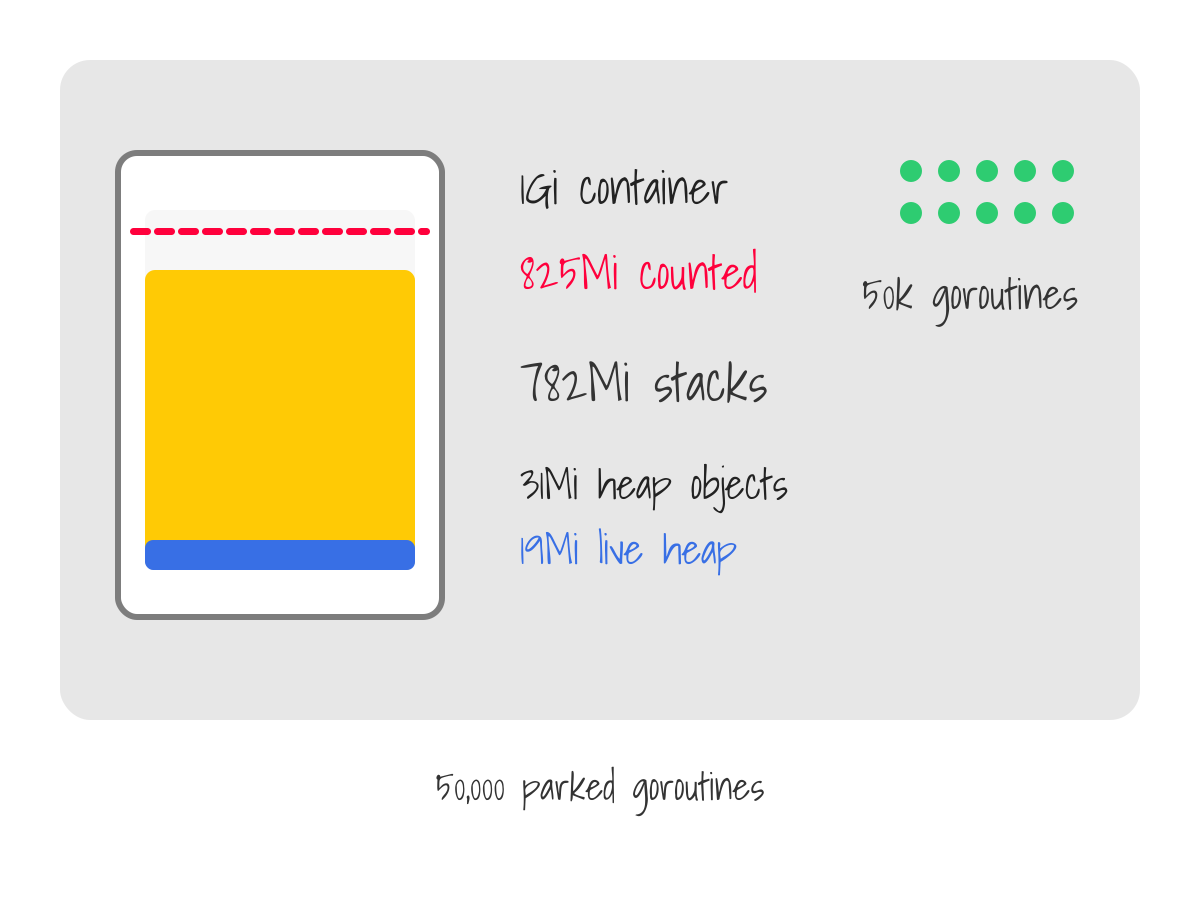
Here is a new 1Gi container with 50,000 parked goroutines:
bash
docker run --rm -d --name go-stacks \
  --memory=1g --memory-swap=1g --cpus=2 \
  -p 127.0.0.1:8080:8080 \
  ghcr.io/learnk8s/go-requests-limits:latest >/dev/null
Wait for the health endpoint:
bash
curl --retry 20 --retry-connrefused --retry-delay 1 \
  -sf localhost:8080/health >/dev/null
Start 50,000 parked goroutines and read their stack usage:
bash
curl -s 'localhost:8080/goroutines?count=50000&stackKb=8' | \
  jq '.after | {lastGCLiveHeapMi, goroutineStacksMi, runtimeAccountedMi}'

{
  "lastGCLiveHeapMi": 18.92,
  "goroutineStacksMi": 781.78,
  "runtimeAccountedMi": 824.89
}
Remove the test container:
bash
docker rm -f go-stacks >/dev/nullThe previous GC found 19Mi of live heap while Go counted 825Mi toward GOMEMLIMIT.
Eight requested frames turned into about 16KiB of reserved stack per goroutine.
A heap-object profile cannot explain stack memory. Those bytes are in stacks, not heap objects.
The two useful numbers here are the goroutine count and /memory/classes/heap/stacks:bytes.
What happens when those stacks alone pass the soft limit?
A leaked goroutine holds its active stack and everything reachable from it.
This workload shows what happens when active stacks alone exceed the soft limit:
bash
docker run -d --name go-limiter \
  --memory=1g --memory-swap=1g --cpus=2 \
  -e GOMEMLIMIT=400MiB \
  -p 127.0.0.1:8080:8080 \
  ghcr.io/learnk8s/go-requests-limits:latest >/dev/null
Wait for the health endpoint:
bash
curl --retry 20 --retry-connrefused --retry-delay 1 \
  -sf localhost:8080/health >/dev/null
Start 30,000 parked goroutines:
bash
curl -s 'localhost:8080/goroutines?count=30000&stackKb=8' | \
  jq -c '.after | {goroutineStacksMi, lastGCLiveHeapMi, runtimeAccountedMi}'
{"goroutineStacksMi":469.06,"lastGCLiveHeapMi":17.39,"runtimeAccountedMi":496.47}
Run the allocation workload and read the GC limiter metrics:
bash
curl -s 'localhost:8080/churn?seconds=5&kb=32' | \
  jq '{gcLimiterLastEnabledCycleChanged, allocationAttemptsPerSec}'

{
  "gcLimiterLastEnabledCycleChanged": true,
  "allocationAttemptsPerSec": 268332
}
Remove the test container:
bash
docker rm -f go-limiter >/dev/nullBefore the churn, Go reports about 496Mi against a 400MiB soft limit.
About 469Mi of that is reserved stack memory.
The collector cannot remove the active frames while those goroutines stay parked, so their stacks alone remain larger than the soft limit.
The endpoint still handled around 268,000 allocation attempts per second.
When memory Go cannot free sits above the soft limit, the runtime caps GC work competing with the application at about half of the available CPU over a short window.
Putting the resource settings together
The measurements in this article support these eight steps, in order:
- Measure total container memory, the live heap found by the previous GC, memory counted toward
GOMEMLIMIT, goroutine count, and stack memory under realistic traffic. - Set
requests.memoryfrom normal container usage. - Set
limits.memoryabove peak container usage with room for variation. - If Go-managed memory accounts for most of the container, set
GOMEMLIMIT5% to 10% belowlimits.memory. Then measure the heap goal, GC cost, and remaining margin. - Make sure that memory counted by Go and memory outside Go's metrics together stay under the container limit. The external portion often needs more than that initial gap.
- Set
requests.cpufrom measured CPU usage. - If your platform requires a CPU limit, set
limits.cpufrom the measured peak. Then readGOMAXPROCSinside the pod. The process can reach fewer CPUs than expected. If no limit is required, decide whether to setGOMAXPROCSnear the CPU available on a busy node. - Validate throttling, GC frequency, GC CPU share, p99 latency, and throughput at those values.
These steps produce YAML based on container usage, a soft memory limit, and the GOMAXPROCS value from a running pod.
The demo's manifest uses the same CPU, memory, and soft limits as the first Docker example:
deployment.yaml
apiVersion: apps/v1
kind: Deployment
metadata:
  name: go-requests-limits
spec:
  replicas: 1
  selector:
    matchLabels:
      app: go-requests-limits
  template:
    metadata:
      labels:
        app: go-requests-limits
    spec:
      containers:
        - name: app
          image: ghcr.io/learnk8s/go-requests-limits:latest
          imagePullPolicy: Always
          env:
            # 10% below limits.memory, leaving room for memory the Go runtime
            # does not account for.
            - name: GOMEMLIMIT
              value: '460MiB'
          ports:
            - containerPort: 8080
          readinessProbe:
            httpGet:
              path: /health
              port: 8080
          livenessProbe:
            httpGet:
              path: /health
              port: 8080
          resources:
            requests:
              cpu: '1'
              memory: 384Mi
            limits:
              # On this two-or-more-CPU affinity mask, this quota produces
              # GOMAXPROCS=2 with Go 1.27's container-aware default.
              cpu: '2'
              memory: 512Mi
Can the downward API fill in GOMEMLIMIT for you?
The downward API exposes limits.memory through a resourceFieldRef environment variable.
Using that value directly as the soft limit leaves no headroom for memory outside Go.
Write the soft limit below the container limit with headroom you have measured, or use a library like automemlimit that reads the container limit and applies a ratio.
After an in-place resize, downward API environment variables keep their startup values.
Downward API volume files can update, but the application logic must apply the new soft limit.
A realistic workload validates changes to these settings.
Summary
Kubernetes gives your container a CPU quota and a memory ceiling, and Go 1.27 reads one of them.
With the container-aware default enabled, GOMAXPROCS follows the container CPU quota, subject to CPU affinity and the minimum of two.
Memory has no equivalent default. GOMEMLIMIT stays unset until you set it, so the collector paces the heap from GOGC alone.
Why not derive it from the container limit?
The runtime manages only part of the container's memory.
The executable, cgo allocations, direct mmap, and cached file data all count against limits.memory. GOMEMLIMIT accounts for none of them.
A soft limit equal to the container limit leaves no headroom for that memory.
If the container exhausts its memory budget and Linux cannot reclaim enough memory, Linux can send a SIGKILL that the process cannot log.
Measurements determine the resource settings.
You run traffic that looks like production, and you read total container memory, the live heap, the memory Go counts, the goroutine count, and stack memory out of that run.
You put GOMEMLIMIT below the container limit with headroom you have measured, and you watch the heap goal and GC CPU instead of subtracting the live heap from the limit.
You read GOMAXPROCS from a running pod rather than from the manifest, because the module's go line and an automaxprocs import can change it.
A stricter parent quota can restrict the pod's CPU without changing Go's selected value.
These numbers remain useful while the measurements stay current. If the goroutine count increases, do another test.