
How does the Kubernetes scheduler work?
February 2026

This is part 4 of 6 of the How the Kubernetes control plane works. More
TL;DR: The Kubernetes scheduler assigns pods to nodes by filtering out unsuitable candidates and scoring the rest. This article explains how that works and how to influence it.
The scheduler decides where your pods are deployed in the cluster.
It might sound like an easy job, but it's rather complicated.
How does it actually work?
Table of contents:
- Back to basics
- The scheduling cycle
- Filtering and scoring in action
- Built-in filter plugins
- Built-in scoring plugins
- Influencing the scheduler
- Why requests matter
- Priority classes and preemption
- Beyond the built-in plugins
- Debugging with the scheduler simulator
Back to basics
Let's start with the basics.
When you have a Kubernetes cluster, you have a collection of servers, virtual machines or bare metal.
One (or more) of these runs the control plane, and the rest join as worker nodes.
From your perspective as a cluster user, you see a single unit.
You deploy workloads, and they run somewhere in the cluster.
You don't really care where, as long as they run.
But Kubernetes needs to translate your request into something that actually runs on the underlying infrastructure.
 1/4
1/4A Kubernetes cluster with three empty worker nodes, ready to receive workloads.
 2/4
2/4A user submits a request to the cluster. The workload needs to be placed somewhere.
 3/4
3/4The cluster behaves a single unified entity.
 4/4
4/4However, those workloads needs to be assigned to a node.
And that's where things get interesting.
Let's follow the journey of a pod from kubectl apply to running a container.
When you submit a deployment with kubectl, the API server receives the request.
The resource passes through several stages—authentication, authorization, admission controllers—and is eventually stored in etcd.
If you want to know more about this flow, check out What happens inside the Kubernetes API server?.

But who creates the pods?
It's a common misconception that it's the scheduler's job to create pods.
It's not. The controller manager does that.
Inside the control plane, the controller manager watches for new Deployments.
When it sees yours, it creates a ReplicaSet.
The ReplicaSet controller then creates the pods to match your desired state.
If you asked for three replicas, three pods are created.

At this point, the pods exist in etcd with a status of "Pending".
They're not assigned to any node yet—they're just records in etcd.
The scheduler is watching the API server for pods without a node assigned to them.
When it spots these new pods, it adds them to its internal queue.

Now the scheduler gets involved.
The scheduling cycle
The scheduler maintains a queue of pods waiting to be scheduled.
It picks them up one by one; not in parallel, but sequentially.
For each pod, the scheduler goes through two phases:
- Scheduling phase: which node should I choose?
- Binding phase: write to the database that this pod belongs to that node.

The scheduling phase is where the real decision-making happens.
It's divided into two parts:
- Filtering (also called predicates): look at all nodes and discard those that can't run this pod.
- Scoring (also called priorities): rank the remaining nodes to find the best fit.

Think of it like finding an apartment.
First, you filter out everything that doesn't meet your requirements: wrong location, too expensive, no pets allowed.
Then, you score the remaining options: this one has a better view, that one is closer to work.
Once the scheduler picks a node, it moves to the binding phase.
This is simply writing a record to etcd that says: "this pod belongs to this node."
The kubelet on that node is watching the API server.
When it sees a pod bound to its node, it takes over and starts the containers.
Let's look at a concrete example.
Filtering and scoring in action
Consider a cluster with nodes with and without a GPU.
A few nodes are also running at full capacity.

You want to deploy a pod that requires a GPU.
You submit the pod to the cluster, and it's added to the scheduler queue.
The scheduler discards all nodes without a GPU (filtering phase).

Next, the scheduler scores the remaining nodes.
In this example, the fully utilized nodes are scored lower.
The empty node wins and is selected.

Built-in filter plugins
What are some examples of filters?
NodeUnschedulableprevents pods from landing on nodes marked as unschedulable.VolumeBindingchecks if the node can bind the requested volume.PodTopologySpreadensures pods are spread across failure domains.NodeResourcesFitverifies the node has enough CPU and memory.
The default filtering phase has 13 plugins.

Here's what's interesting about filters: each one is a pass/fail gate.
If any filter rejects a node, that node is out—regardless of what other filters say.
It's a strict AND: the node must pass all 13 checks to remain a candidate.
Some of these filters are "invisible" to most users but critically important.
For example, NodeAffinity is a single plugin that handles both nodeSelector and node affinity rules.
When you add a nodeSelector to your pod, you're not invoking some special mechanism—you're just giving the NodeAffinity filter a reason to reject nodes that don't match.
Built-in scoring plugins
Here are some examples of scoring:
ImageLocalityprefers nodes that already have the container image downloaded locally.NodeResourcesBalancedAllocationprefers underutilized nodes.InterPodAffinityscores nodes based on pod affinity rules.
There are 13 plugins to decide how to score and rank nodes.

Unlike filters, scoring isn't pass/fail—it's a weighted sum.
Each scoring plugin assigns a score from 0 to 100 to every candidate node.
That score is then multiplied by a configurable weight.
The node with the highest total score wins.
This is powerful because you can change the scheduler's behavior without writing code, you just adjust the weights.
For example, NodeResourcesBalancedAllocation prefers nodes that would remain balanced after the pod is placed.
It encourages spreading pods across nodes.
But what if you want the opposite (e.g., bin-packing), where you fill nodes to capacity before using new ones?
You can enable the NodeResourcesMostAllocated plugin (disabled by default) and increase its weight.
Same scoring mechanism, completely different strategy.
This is the foundation of scheduler profiles: different weight configurations for different use cases.
Influencing the scheduler
So far, the scheduler has been making all the decisions.
But sometimes you know something the scheduler doesn't.
Maybe your pod needs a GPU.
Maybe it should run close to a database for latency reasons.
Maybe you have nodes reserved for production workloads only.
Kubernetes provides several mechanisms to influence where pods land.
Let's explore them.
Scenario 1: "I need a GPU."
You have a cluster with some GPU nodes and some regular nodes.
Your machine learning pod needs a GPU—it won't work without one.
The simplest solution is nodeSelector.
You label your GPU nodes:
bash
kubectl label nodes node-1 gpu=true
kubectl label nodes node-2 gpu=true
Then you tell your pod to only run on nodes with that label:
pod.yaml
spec:
  nodeSelector:
    gpu: 'true'
The scheduler will now filter out any node without gpu=true.
 1/2
1/2A pod with a nodeSelector for gpu=true is submitted to a cluster with three nodes, only one of which has the required label.
 2/2
2/2The scheduler filters out the nodes without the label and schedules the pod on the only matching GPU node.
Simple, strict, and effective.
Scenario 2: "I'd prefer a GPU, but I can live without one."
Your pod runs faster on GPU nodes, but it can fall back to CPU if needed.
What happens if you use nodeSelector and no GPU nodes are available?
The pod stays pending. Forever.
nodeSelector is binary: either a node has the label, or it doesn't.
There's no middle ground, no "I'd prefer this, but I'll take that."
What if you want exactly that kind of flexibility?
That's where node affinity comes in.
Node affinity gives you two types of rules:
Hard constraints (requiredDuringSchedulingIgnoredDuringExecution) work like nodeSelector.
When no node matches, the pod doesn't schedule.
Soft constraints (preferredDuringSchedulingIgnoredDuringExecution) are preferences.
The scheduler tries to satisfy them but will fall back if necessary.
pod.yaml
spec:
  affinity:
    nodeAffinity:
      preferredDuringSchedulingIgnoredDuringExecution:
        - weight: 100
          preference:
            matchExpressions:
              - key: gpu
                operator: In
                values: ['true']
With this configuration, the scheduler will prefer GPU nodes.
But if none are available, it will schedule on a regular node instead of leaving the pod pending.
The weight (1-100) determines how strongly this preference influences the final decision.
How does this work under the hood?
Remember the filter and scoring plugins from earlier?
Hard constraints are implemented as filters: nodes that don't match are eliminated before scoring even begins.
Soft constraints are implemented as scoring: matching nodes get bonus points, multiplied by the weight you set.
- A weight of 100 means this preference matters a lot.
- A weight of 10 means it's a minor factor.
Same scheduling framework, different extension points.
So far, we've been creating our own labels with kubectl label.
But in practice, many useful labels are already there.
Cloud providers like AWS, GCP, and Azure automatically label nodes with their hostnames, availability zones, regions, and instance types.
On bare metal, tools like Node Feature Discovery can detect hardware characteristics and automatically apply labels.
These labels are the foundation for how Kubernetes understands the physical layout of your infrastructure.
A quick detour: understanding topologies
Before we go further, we need to talk about how Kubernetes thinks about location.
Every node in your cluster has labels that describe where it sits in your infrastructure:
kubernetes.io/hostname: node-1
topology.kubernetes.io/zone: eu-west-1a
topology.kubernetes.io/region: eu-west-1
These labels form a hierarchy: a region contains multiple zones, and a zone contains multiple nodes.
When we talk about "topology" in Kubernetes, we're asking: how do you want to group nodes?
If you group by kubernetes.io/hostname, each node is its own group—because each hostname is unique.
If you group by topology.kubernetes.io/zone, all nodes in eu-west-1a form one group, and all nodes in eu-west-1b form another.

Why does this matter?
Because sometimes you care about where pods are relative to each other.
And not just which node they're on, but whether they're in the same zone, rack, or data center.
With this in mind, let's see what happens when you want two pods to run side by side.
Scenario 3: "I need to be close to the database."
Your web application constantly talks to a Redis cache.
Network latency matters and you want the app pod to run on the same node as Redis.
So far, all our constraints have been about which nodes a pod should land on.
But what if the constraint is about other pods?
Your app doesn't care about node labels.
It cares about being near Redis.
This is what pod affinity is for.
pod.yaml
spec:
  affinity:
    podAffinity:
      requiredDuringSchedulingIgnoredDuringExecution:
        - labelSelector:
            matchLabels:
              app: redis
          topologyKey: kubernetes.io/hostname
This configuration says: "Schedule this pod on a node that already runs a pod with app=redis."
The topologyKey defines what "same location" means.
Remember the topology labels we just discussed?
With kubernetes.io/hostname, it means the same node.
With topology.kubernetes.io/zone, it means the same availability zone.
 1/2
1/2With topologyKey: kubernetes.io/hostname, the scheduler binds the pod to the same node where the target pod is already running.
 2/2
2/2With topologyKey: topology.kubernetes.io/zone, the scheduler can place the pod on any available node within the same availability zone.
This is useful when you want pods to be "close" but not necessarily on the same machine.
Scenario 4: "Don't put all my replicas on one node."
Imagine you're running CoreDNS in your cluster.
You have three replicas for redundancy.
But what if all three land on the same node?
If that node crashes, every pod in the cluster loses DNS resolution.
No DNS means no service discovery.
Your entire cluster is effectively down, even though only one node failed.
This isn't a theoretical problem.
When OpenAI scaled their clusters to 7,500 nodes, they encountered similar challenges.
The default scheduler will happily pack pods onto the same node if that node scores highest.
At scale, this becomes a reliability risk.
How do you force pods apart?
Pod anti-affinity repels pods from each other.
pod.yaml
spec:
  affinity:
    podAntiAffinity:
      requiredDuringSchedulingIgnoredDuringExecution:
        - labelSelector:
            matchLabels:
              app: coredns
          topologyKey: kubernetes.io/hostname
This configuration says: "Don't schedule this pod on a node that already runs a pod with app=coredns."
Since all CoreDNS replicas share the same label, they'll be forced onto different nodes.
But what if you have more replicas than nodes?
With 5 replicas and 3 nodes, pod anti-affinity fails.
The fourth pod can't schedule since every node already has a CoreDNS pod, violating the rule.

This is where topology spread constraints come in.
pod.yaml
spec:
  topologySpreadConstraints:
    - maxSkew: 1
      topologyKey: kubernetes.io/hostname
      whenUnsatisfiable: DoNotSchedule
      labelSelector:
        matchLabels:
          app: coredns
Instead of saying "never on the same node," this says: "keep the difference in pod count between nodes to at most 1."
With 5 replicas and 3 nodes, you get a 2-2-1 distribution, and everyone gets scheduled.
With 3 replicas and 3 nodes, you get 1-1-1.
The maxSkew parameter controls how much imbalance you'll tolerate.
A skew of 1 means the busiest node can have at most 1 more pod than the quietest node.
The hidden danger of topology spread constraints
Topology spread constraints sound great.
But they have a subtle failure mode that has caught many teams off guard.
Let's walk through a scenario.
You have a cluster with 3 availability zones: zone-a, zone-b, and zone-c.
You deploy an application with 3 replicas and this constraint:
topologySpreadConstraints:
  - maxSkew: 1
    topologyKey: topology.kubernetes.io/zone
    whenUnsatisfiable: DoNotSchedule
    labelSelector:
      matchLabels:
        app: my-app
The scheduler places one pod in each zone. Perfect: 1-1-1.
Now, zone-b has a problem.
Maybe a node runs out of memory.
Maybe there's a capacity shortage.
The pod in zone-b gets evicted.
You now have 2 pods: one in zone-a, one in zone-c.
The scheduler tries to reschedule the evicted pod. Where can it go?
zone-aalready has 1 pod. Adding another would make it 2-0-1. That's a skew of 2—violatesmaxSkew: 1.zone-calready has 1 pod. Same problem.zone-bis the only option that maintains the skew. Butzone-bis out of capacity.
The pod stays pending.
The scheduler is doing exactly what you told it to do.
Martin from Umbraco learned this the hard way during a Friday afternoon production incident.
A new service consumed the remaining memory in one zone.
Pods couldn't be rescheduled to other zones because of the topology constraint.
The team spent hours debugging before realizing the scheduler was working correctly, only to find that the constraint was too strict.
What's the fix?
One option is to use whenUnsatisfiable: ScheduleAnyway instead of DoNotSchedule.
pod.yaml
topologySpreadConstraints:
  - maxSkew: 1
    topologyKey: topology.kubernetes.io/zone
    whenUnsatisfiable: ScheduleAnyway
    labelSelector:
      matchLabels:
        app: my-app
With ScheduleAnyway, the constraint becomes a preference rather than a hard rule.
The scheduler will try to maintain the skew, but if it can't, it will schedule the pod somewhere rather than leaving it pending.
The tradeoff: you might end up with uneven distribution, but at least your pods are running.
Another option is to combine topology spread constraints with sufficient cluster capacity and headroom.
If your zones always have spare capacity, the problem never arises.
There's no perfect answer.
The right choice depends on whether you'd rather have uneven distribution or pending pods.
The bigger takeaway here is that scheduling decisions are surprisingly hard to predict.
You build a mental model of how things should work.
You deploy your constraints.
And then the scheduler does something unexpected because the interaction between constraints, cluster state, and available capacity is more complex than you anticipated.
This is why understanding how the scheduler works matters.
And why testing your scheduling constraints can save you from a Friday afternoon incident.
We'll look at a tool that makes this kind of testing practical—the scheduler simulator—later in this article.
Scenario 5: "Stop wasting my expensive GPU nodes."
You've added GPU nodes to your cluster, and they cost 10 times as much as regular nodes.
But you notice something odd: log collectors, monitoring agents, and random utility pods are being scheduled on them.
These pods don't need GPUs, and they're just wasting expensive hardware.
Why is this happening?
Because the scheduler doesn't know these nodes are special.
As far as it's concerned, a GPU node is just another node with available capacity.
You could use nodeSelector to direct GPU workloads to GPU nodes.
But that solves the wrong problem.
You don't want to attract pods to GPU nodes; instead, you want to repel pods away from them by default.
This is where taints and tolerations come in.
Cloud providers like GKE, EKS, and AKS often taint GPU nodes automatically for exactly this reason.
Let's see how it works.
You taint the GPU nodes:
bash
kubectl taint nodes gpu-node-1 nvidia.com/gpu=true:NoScheduleBy default, no pod can be scheduled on gpu-node-1, and the taint repels all pods.
The only pods that can land there are ones that explicitly tolerate the taint:
pod.yaml
spec:
  tolerations:
    - key: nvidia.com/gpu
      operator: Equal
      value: 'true'
      effect: NoSchedule
Your ML training pods include this toleration.
Your log collectors don't: problem solved.
Notice the reversal from affinity: instead of pods saying "I want to go here," nodes are saying "stay away unless you're special."
Taints can have three effects:
NoSchedule: don't schedule pods that don't tolerate this taint.PreferNoSchedule: try to avoid scheduling, but it's not mandatory.NoExecute: evict running pods that don't tolerate this taint.
This API is notoriously confusing.
You're reasoning in double negatives: "this pod tolerates nodes that repel pods without this toleration."
It takes a while to build intuition.
Putting it all together
Each mechanism solves a different problem:
| Mechanism | Use when... |
|---|---|
nodeSelector | You need a specific node type (strict) |
| Node affinity | You prefer a node type but can fall back (flexible) |
| Pod affinity | Pods need to be co-located with other pods |
| Pod anti-affinity | Pods need to be spread away from each other |
| Topology spread constraints | You need fine-grained control over pod distribution |
| Taints and tolerations | Nodes should repel pods by default |
You can combine them.
A pod can have a nodeSelector, a node affinity preference, a pod anti-affinity rule, and a toleration—all at the same time.
The scheduler will consider all of them when making its decision.
Here's a realistic example: a production ML training pod that needs everything.
pod.yaml
apiVersion: v1
kind: Pod
metadata:
  name: ml-training
  labels:
    app: ml-training
    team: research
spec:
  # Must run on GPU nodes (hard requirement)
  nodeSelector:
    accelerator: nvidia-a100

  # Tolerate the GPU node taint
  tolerations:
    - key: nvidia.com/gpu
      operator: Equal
      value: 'true'
      effect: NoSchedule

  affinity:
    # Prefer nodes in eu-west-1, but can fall back to other regions
    nodeAffinity:
      preferredDuringSchedulingIgnoredDuringExecution:
        - weight: 100
          preference:
            matchExpressions:
              - key: topology.kubernetes.io/region
                operator: In
                values: ['eu-west-1']

    # Don't schedule on a node that already has another ML-training pod
    podAntiAffinity:
      requiredDuringSchedulingIgnoredDuringExecution:
        - labelSelector:
            matchLabels:
              app: ml-training
          topologyKey: kubernetes.io/hostname

  containers:
    - name: training
      image: ml-training:latest
      resources:
        limits:
          nvidia.com/gpu: 1
What happens when this pod is submitted?
- The
nodeSelectorfilter eliminates all non-GPU nodes. - The
TaintTolerationfilter allows GPU nodes (which are tainted) to remain candidates. - The
PodAntiAffinityfilter eliminates nodes that already run anml-trainingpod. - The node affinity scores
eu-west-1nodes higher than others. - The remaining scoring plugins break ties.
The scheduler finds the intersection of all these constraints, scores the remaining candidates, and picks the winner.
We've spent a lot of time discussing where pods should go: which nodes to target, which to avoid, how to spread replicas.
But there's a more fundamental question we haven't addressed: how does the scheduler know if a pod will actually fit on a node?
Why requests matter
There's a chicken-and-egg problem with scheduling.
The scheduler needs to know how much memory and CPU a pod will use to place it on a node.
But the application isn't running yet, so how can the scheduler know?

It can't. You have to tell it.
This is why you define requests in your pod spec:
pod.yaml
resources:
  requests:
    memory: '512Mi'
    cpu: '250m'
Requests tell the scheduler: "This pod needs at least this much memory and CPU."

Without requests, the scheduler has no idea how to size your pod.
From its perspective, a pod without requests has no size, so it can fit anywhere.
What could go wrong?
If all your pods lack requests, the scheduler might pack too many onto a single node.
When those pods actually start consuming resources, you'll run out of memory or CPU.
How does the scheduler actually check if a pod fits on a node?
Remember the filtering phase where each plugin acts as a pass/fail gate?
One of those plugins is NodeResourcesFit.
It compares your pod's requests against the node's allocatable capacity (the resources remaining after accounting for the operating system, the kubelet, and other pods already running on the node.)

If the numbers don't add up, the node is filtered out.
No requests? The filter has nothing to check.
Every node appears to have infinite capacity.
The scheduler will happily pack pods until something breaks.
The problem with static requests
Here's the catch: requests are static.
You set them once in your pod spec, and the scheduler uses those numbers forever, even if your application's actual usage is completely different.
What happens when you get requests wrong?
Set them too high: you waste resources.
If you request 4GB of memory but only use 500MB, the remaining 3.5GB sits unused.

No other pod can claim it: requests are guaranteed.
The kubelet reserves that capacity the moment your pod is scheduled, whether you use it or not.
Set them too low: you risk overcommitment.
If you request 500 MB but actually use 2GB, the scheduler thinks the node has more space than it actually does.
Eventually, pods start competing for resources that aren't available, and the kubelet starts evicting pods to reclaim memory.

And here's the real problem: applications change.
Your pod might use 500MB today and 2GB next month after a new feature ships.
The requests you set six months ago no longer reflect reality.
Some teams try to solve this with vertical pod autoscalers that dynamically adjust requests.
Others monitor and update requests manually.
But fundamentally, the scheduler is making decisions based on what you claimed your pod would use and not what it's actually using.
When the cluster runs out of space
So what happens when every node is full, or at least, every node appears full based on requests?
Your new pod stays pending. No node passes the NodeResourcesFit filter.
But what if your new pod is critical?
What if it absolutely must run, even if it means displacing something else?
Priority classes and preemption
How can the scheduler decide which existing pod to evict?
How do you tell it which pod is more important?
This is where priority classes come in.
You assign a priority value to your pods.
When the cluster is full, the scheduler can preempt (evict) lower-priority pods to make room for higher-priority ones.
This is controlled through PriorityClasses.
A PriorityClass assigns a priority value to pods:
priority-class.yaml
apiVersion: scheduling.k8s.io/v1
kind: PriorityClass
metadata:
  name: high-priority
value: 1000000
globalDefault: false
description: 'Critical production workloads'
Higher values mean higher priority.
The default priority for pods without a class is zero.
You can reference the priority class in your pod spec:
pod.yaml
apiVersion: v1
kind: Pod
metadata:
  name: critical-app
spec:
  priorityClassName: high-priority
  containers:
    - name: app
      image: nginx
Let's have a look at how preemption works.
When you submit a pod, and there's no space, the scheduler doesn't immediately give up.
Instead, it checks: "Can I evict lower-priority pods to make room?"
Here's what happens:
- The pod is added to the scheduler's queue, which is ordered by priority—higher-priority pods are scheduled first.
- The scheduler tries to find a node with enough space.
- If no node fits, the
PostFilterplugin kicks in and looks for nodes where preempting lower-priority pods would create space. - It selects which pods to preempt using these rules:
- Minimize the number of Pod Disruption Budget (PDB) violations.
- Prefer preempting the lowest-priority pods.
- Minimize the total number of preemptions needed.
- The selected pods are terminated. Their controllers (like ReplicaSets) will create replacement pods, which enter the queue as new pending pods.
- The high-priority pod gets scheduled on the now-freed node.
The replacement pods will stay pending until there's space for them or trigger the cluster autoscaler to add new nodes.
Preemption in practice
Consider a cluster with two nodes running four yellow pods (priority: 100).

You scale up a deployment of red pods (priority: 1000) that needs more space than available.
The scheduler will preempt the yellow pods to make room for the red ones.
The yellow pods go back to pending, potentially triggering the autoscaler.

Important: Pods with the same priority won't preempt each other.
If you don't set any priority classes, all pods have priority zero, and no preemption occurs.
Beyond the built-in plugins
We've been discussing filter and scoring plugins throughout this article.
The 13 filters. The 13 scoring functions. Adjustable weights.
But what happens when those aren't enough?
"I want to schedule based on actual CPU utilization, not static requests."
We just discussed how requests are static.
They don't reflect what your pods are actually using, just what you claimed they'd use months ago.
The Trimaran plugin solves this.
It collects real-time metrics from your cluster and scores nodes based on actual utilization.
A node that's 80% utilized gets a lower score than one that's 40% utilized, regardless of the requests.
This is load-aware scheduling.
It's what you'd expect the scheduler to do by default, but it requires metrics infrastructure that the scheduler doesn't have out of the box.
"I need all 8 pods to land on nodes simultaneously—or not at all."
Machine learning training jobs often work this way.
You have 8 worker pods that need to communicate with each other.
If only 7 are scheduled and the 8th stays pending, the other 7 sit idle.
The Coscheduling plugin (also called gang scheduling) holds pods at the Permit stage until all pods in the group can be scheduled together.
Either they all go, or none of them go.
"My workload is latency-sensitive and needs specific CPU cores."
On NUMA (Non-Uniform Memory Access) architectures, which CPU cores your pod uses matters.
Accessing memory attached to a different CPU socket is slower.
The Node Resource Topology plugin makes the scheduler NUMA-aware.
It considers CPU and memory topology when placing pods, ensuring latency-sensitive workloads get the resources they need.
How do these plugins actually work?
These aren't hacks or workarounds.
The scheduler was designed for this.
Every built-in filter and scoring function we've discussed is itself a plugin.
The scheduler exposes extension points—hooks at specific stages of the scheduling cycle where custom logic can plug in.
The key extension points:
| Extension Point | What it does |
|---|---|
Filter | Exclude nodes that can't run the pod |
Score | Rank the remaining nodes |
PostFilter | Handle the case when no node fits (preemption lives here) |
Permit | Approve, deny, or delay binding (Coscheduling uses this) |
Trimaran hooks into Score to rank nodes by actual utilization.
Coscheduling hooks into Permit to hold pods until the gang is ready.
The preemption logic we discussed earlier?
That's a PostFilter plugin.
You can disable built-in plugins, change their weights, or add new ones alongside them—all through scheduler configuration.
There's a catch: this requires access to the control plane.
If you're running a managed Kubernetes service like EKS, GKE, or AKS, the cloud provider manages the scheduler for you, and most don't let you customize its configuration.
In that case, you're limited to the built-in plugins and the mechanisms we covered earlier (affinity, taints, topology spread constraints, priority classes).
That said, you can still deploy a second scheduler alongside the managed one by specifying a custom schedulerName in your pod spec.
But that comes with its own operational complexity—you're now responsible for running and maintaining a scheduler.
The Kubernetes community maintains a collection of production-ready plugins at kubernetes-sigs/scheduler-plugins.
Debugging with the scheduler simulator
Remember the topology spread constraints example?
The scheduler placed one pod per zone—until a zone ran out of capacity, at which point the replacement pod remained pending.
Martin's team spent hours debugging before realizing the scheduler was doing exactly what they asked.
In production, you might have pods with node affinity, anti-affinity, tolerations, topology spread constraints, and priority classes—all at the same time.
Predicting what the scheduler will do in your head becomes nearly impossible.
Why did my pod land on node-3 instead of node-1?
Which filter excluded node-2?
What if you could watch the scheduler make its decisions?
The kube-scheduler-simulator lets you do exactly that.
It's a web-based tool that visualizes the scheduler's decision-making process.
You can:
- See which plugins filtered out which nodes.
- View the scores each node received.
- Understand exactly why a pod was placed where it was.
- Test scheduler configurations without a real cluster.
The simulator uses KWOK (Kubernetes Without Kubelet) to create fake nodes, so you can experiment with large clusters on your laptop.
It's particularly useful for:
- Learning how the scheduler works.
- Debugging placement issues.
- Testing custom scheduler configurations.
- Validating topology spread constraints.
You can find it at kubernetes-sigs/kube-scheduler-simulator.
A quick walkthrough
Let's see the simulator in action.
First, clone the repository and start it locally:
git clone git@github.com:kubernetes-sigs/kube-scheduler-simulator.git
cd kube-scheduler-simulator
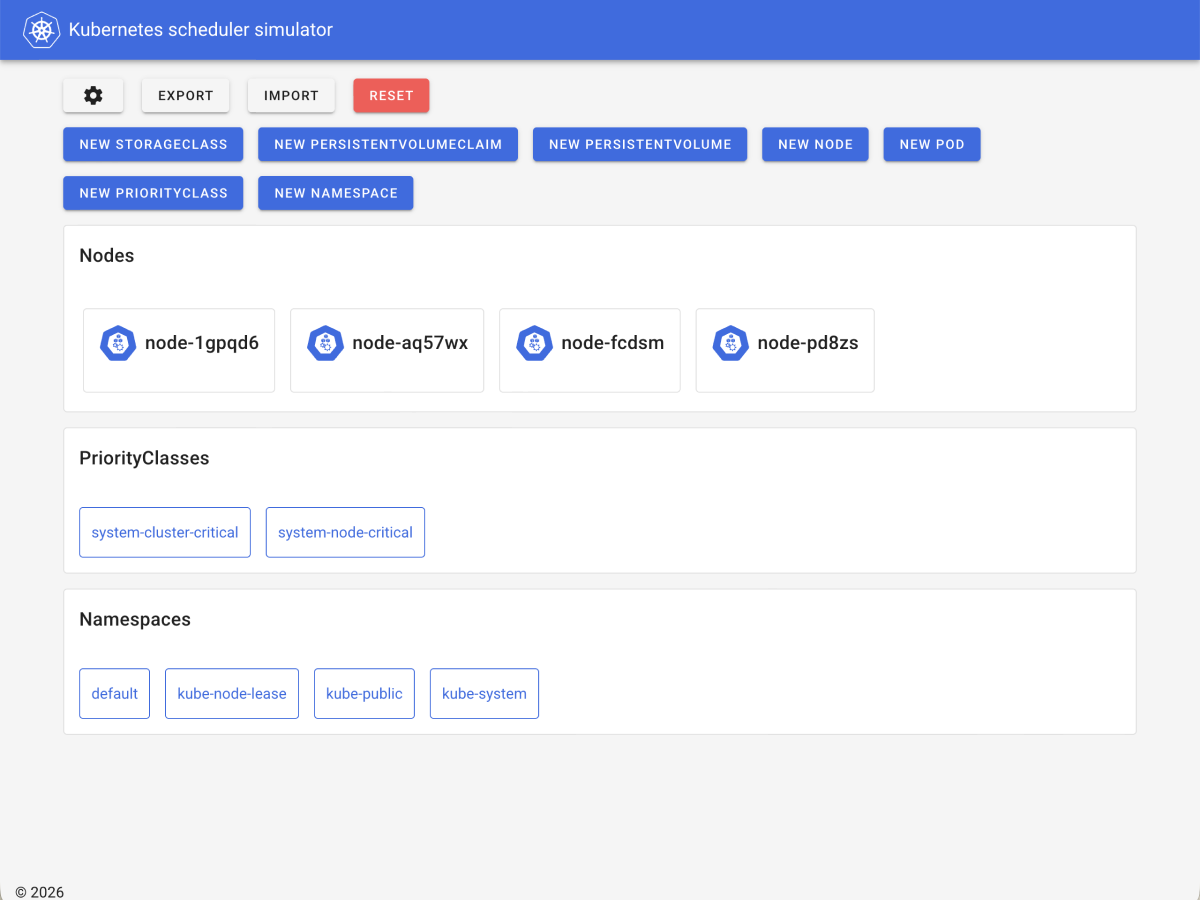
make docker_upOpen http://localhost:3000 in your browser. You'll see an empty cluster.
Create a few nodes by clicking "Add Node" and giving them different labels—maybe zone: a and zone: b for some, and gpu: true for others.
Now create a pod with a nodeSelector for GPU nodes.
The simulator will show you exactly what happened:
- Which nodes were considered
- Which nodes were filtered out (and by which plugin)
- The scores each remaining node received
- Which node was selected and why
The simulator makes the scheduler's decision-making process transparent.
It's the fastest way to build intuition for how scheduling constraints interact and to debug why your pods aren't landing where you expect.
What's next
Once the scheduler decides where a pod should run, it creates a binding: a record in etcd that says "this pod belongs to this node."
But the pod still isn't running as a container.
That's the kubelet's job.
The kubelet on the selected node watches the API server, sees the new binding, and starts creating containers.
But that's a story for another article.